

Two companies can report a $200 CAC and still mean completely different things. One may count only paid media. The other may include sales salaries, agency fees, software and other acquisition costs. One may count new customers while the other counts new orders. That is why CAC benchmarks need a definition before they need a number. Published CAC figures can help you understand the market, but they cannot tell you what your business should spend until you know what each number includes.
This guide fixes that problem first. It separates the main CAC definitions, shows where current category data is actually comparable and explains how to set a target from your own economics. The goal is not to find one magic industry number. It is to know whether the number you are comparing against measures the same thing as yours.
Key Takeaways
- Define CAC before comparing benchmarks: Paid, blended and fully loaded CAC measure different things, so they should not be treated as interchangeable.
- Category benchmarks need context: Published CAC figures vary by category, customer type, acquisition method, sample and year. A number without its definition can mislead.
- Your economics set the CAC limit: Contribution margin and acceptable payback should determine what your business can afford, with external benchmarks used only as context.
- Focus on the levers that change CAC: Offer and pricing, conversion rate optimisation, channel mix, creative and retention can all affect acquisition economics.
- Check every benchmark before using it: Review the publisher, sample, CAC definition, time period and whether the figure is a median or mean before adding it to a planning discussion.
The definition problem, and how to fix it first
The basic CAC formula
The simplest calculation is:
CAC = acquisition spend ÷ new customers acquired
But that formula hides the most important question: what counts as acquisition spend? Three versions appear often enough to keep separate.
Blended CAC
Blended CAC = total sales and marketing spend ÷ total new customers
This gives you a broad view of what the business spends to acquire customers across paid, organic, referral and other acquisition activity.
Paid CAC
Paid CAC = paid acquisition spend ÷ new customers attributed to paid channels
This is more useful when you are evaluating paid acquisition, but it does not represent the full cost of the acquisition system.
Fully loaded CAC
Fully loaded CAC = all acquisition-related sales and marketing costs ÷ new customers
Depending on the company’s accounting rules, this can include media, agency fees, sales compensation, marketing salaries, software and other costs. The rest of this article keeps these definitions separate.
A paid CAC is not treated as equivalent to a blended CAC, and a channel-specific number is not presented as a company-wide benchmark. That distinction matters when looking at customer acquisition cost by industry. Two figures can look similar while measuring completely different acquisition systems.
CAC benchmarks by category
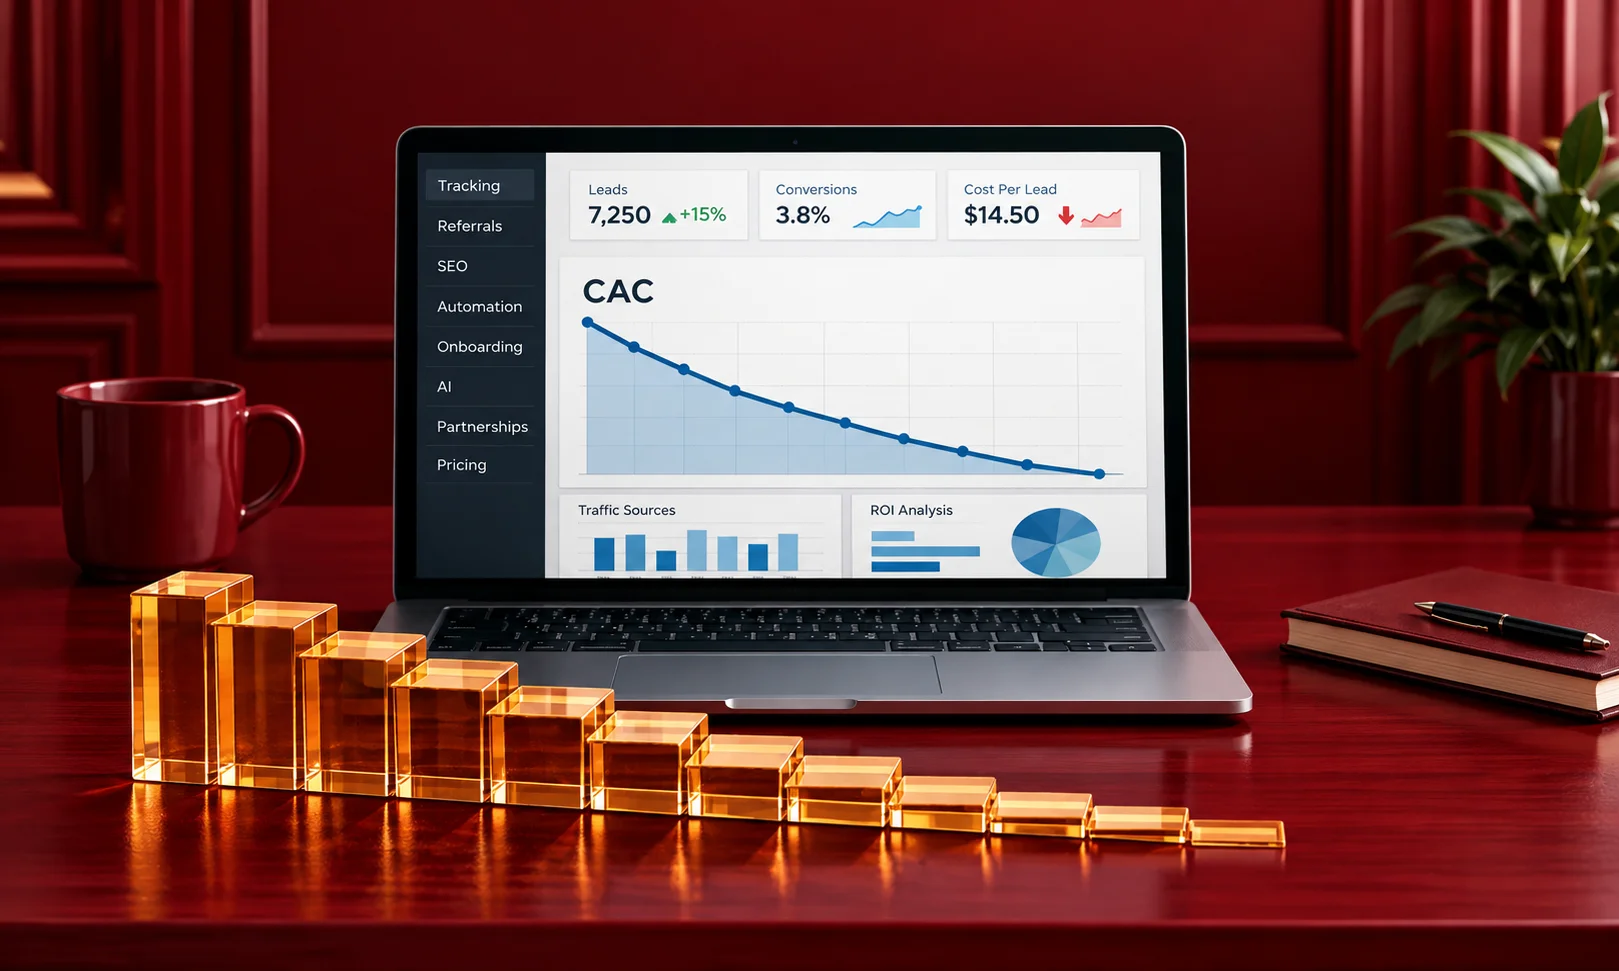
There is no single public 2026 dataset that gives clean, comparable CAC, payback and LTV: CAC figures for every category in this brief. That is not a weakness in the article. It is one of the most important facts about CAC benchmarking.
The table below uses figures where the source clearly defines the acquisition measure. The B2C figures use paid CAC. The B2B figures use inorganic CAC, which primarily represents paid acquisition. They are therefore kept separate rather than blended into one artificial industry range.
| Category | Published CAC range or figure | CAC definition | Typical payback | LTV: CAC | Main driver |
| Consumer goods and DTC | $68 | Paid CAC | No comparable category figure | No comparable category figure | Order value and repeat purchase |
| Subscription and membership | No clean category figure | Not comparable | No clean category figure | No clean category figure | Retention and recurring revenue |
| Small business software | $341 | Inorganic CAC | Under ~12 months is a common SMB SaaS guide | 3:1 is a common SaaS rule of thumb | Contract value and sales motion |
| Enterprise software | No clean 2026 category figure | Not comparable | 12–24 months is common for larger-contract SaaS | 3:1 is a common SaaS rule of thumb | Deal size and sales cycle |
| Marketplaces | No defensible comparable figure | Not comparable | No clean category figure | No clean category figure | Liquidity and repeat activity |
| Financial services | $173 B2C / $1,202 B2B | Paid CAC / inorganic CAC | No comparable category figure | No comparable category figure | Trust, compliance and product value |
| Health services | $176 | Paid CAC | No comparable category figure | No comparable category figure | Local demand and conversion |
| Education | $177 B2C / $1,985 B2B | Paid CAC / inorganic CAC | No comparable category figure | No comparable category figure | Enrollment value and sales cycle |
The B2C figures come from a dataset covering 103 agency clients from 2021 through 2025. It separates organic and paid acquisition rather than treating them as one CAC figure. The reported paid CAC was $68 for ecommerce, $173 for financial services, $176 for medical practices and $177 for higher education.
The B2B figures come from a January 2026 industry dataset that separates organic and inorganic acquisition. Its inorganic CAC was $341 for B2B SaaS, $1,202 for financial services and $1,985 for education. These figures should not be combined with the B2C paid figures because the populations and definitions differ.
For SaaS payback, current guidance puts SMB-focused businesses at under roughly 12 months and larger-contract enterprise SaaS at roughly 12 to 24 months. Those are business-model guide rails rather than universal category benchmarks.
So what is a good customer acquisition cost? There is no universal dollar amount. A good CAC is one the business can recover within its acceptable payback period while leaving enough contribution margin to support profitable growth.
Why CAC differs so much between categories
Price changes the ceiling:
A business selling a $40 product cannot use the same acquisition economics as a company selling a $4,000 annual software contract.
The higher-value business can support more acquisition spend if enough contribution margin remains after the sale.
Purchase frequency changes the economics:
A customer who buys once has a different value from one who purchases every month. Subscription businesses can recover acquisition costs across repeated payments. DTC businesses with strong repeat purchase behavior can also support a higher CAC than businesses with little repeat demand.
Sales cycles add cost:
A self-serve product may acquire a customer without a salesperson becoming involved. Enterprise software can require demos, sales calls, proposals, procurement and multiple decision-makers. Those activities add acquisition costs before the customer ever pays.
Regulation can add friction:
Financial services, healthcare and other regulated categories can face additional requirements around advertising, approvals, claims and onboarding. That can increase the work required to turn a prospect into a customer.
Customer value changes the meaning of CAC:
This is the point many benchmark articles miss. A high CAC is not automatically bad if the customer generates enough contribution margin over time to recover it and produce an acceptable return. A $1,000 CAC can therefore make sense for one business and fail for another.
What a benchmark cannot tell you

A published CAC tells you what happened inside a particular dataset. It does not tell you what your business can afford.
That decision depends on your own unit economics. Contribution margin tells you how much money remains after the direct costs of serving the customer. Acquisition payback tells you how long it takes to recover CAC from that margin. Customer lifetime value gives you a longer view of the value a customer may generate.
The related DTC unit economics piece covers the detailed calculations, so this article does not repeat them. Use that framework when you need to model contribution margin, payback and lifetime value.
For SaaS, payback is particularly useful because two companies can have the same CAC and very different recovery periods. Gross margin belongs in the calculation because revenue is not the same as money available to recover acquisition cost.
So the question should not be: “Is our CAC below the industry average?” It should be: “Can our business recover this CAC fast enough while leaving enough contribution margin to support growth?”
What moves your CAC fastest
The fastest levers are not always marketing levers. Some of the biggest changes come from the offer, pricing or business model.
| Lever | Speed | Effort | What can change |
| Offer and pricing | Fast | Medium | Conversion and customer value |
| Conversion rate optimisation | Medium | Medium | More customers from the same traffic |
| Channel mix | Medium | High | Cost and quality of acquired customers |
| Creative | Fast | Medium | Response and paid-media efficiency |
| Retention | Slow | High | Customer value and affordable CAC |
1. Offer and pricing
A stronger offer can increase conversion without increasing media spend. Pricing can also change the economics of every acquired customer. That makes commercial decisions part of CAC management.
2. Conversion rate optimisation
If the same traffic produces more customers, CAC falls. That can come from a better landing page, clearer product information, stronger proof or fewer checkout steps. Conversion rate optimisation is one important lever, but it is not a universal fix.
3. Channel mix
Different channels can bring customers at very different costs. Paid social, search, referrals, partnerships, organic search and sales outreach each have different economics. The channel with the lowest visible CAC is not automatically the best channel if it produces lower-value customers.
4. Creative
Creative can change paid acquisition efficiency by affecting response rates and conversion quality. However, better creative cannot repair an offer that customers do not want or a landing page that creates friction.
5. Retention
Retention takes longer to change, but it affects how much acquisition spend the business can afford. If customers stay longer and generate more contribution margin, the business can support a higher CAC while maintaining its economic goals. That is why CAC trends should be viewed alongside retention and customer value rather than as an isolated marketing number.
How to set a CAC target you can actually defend
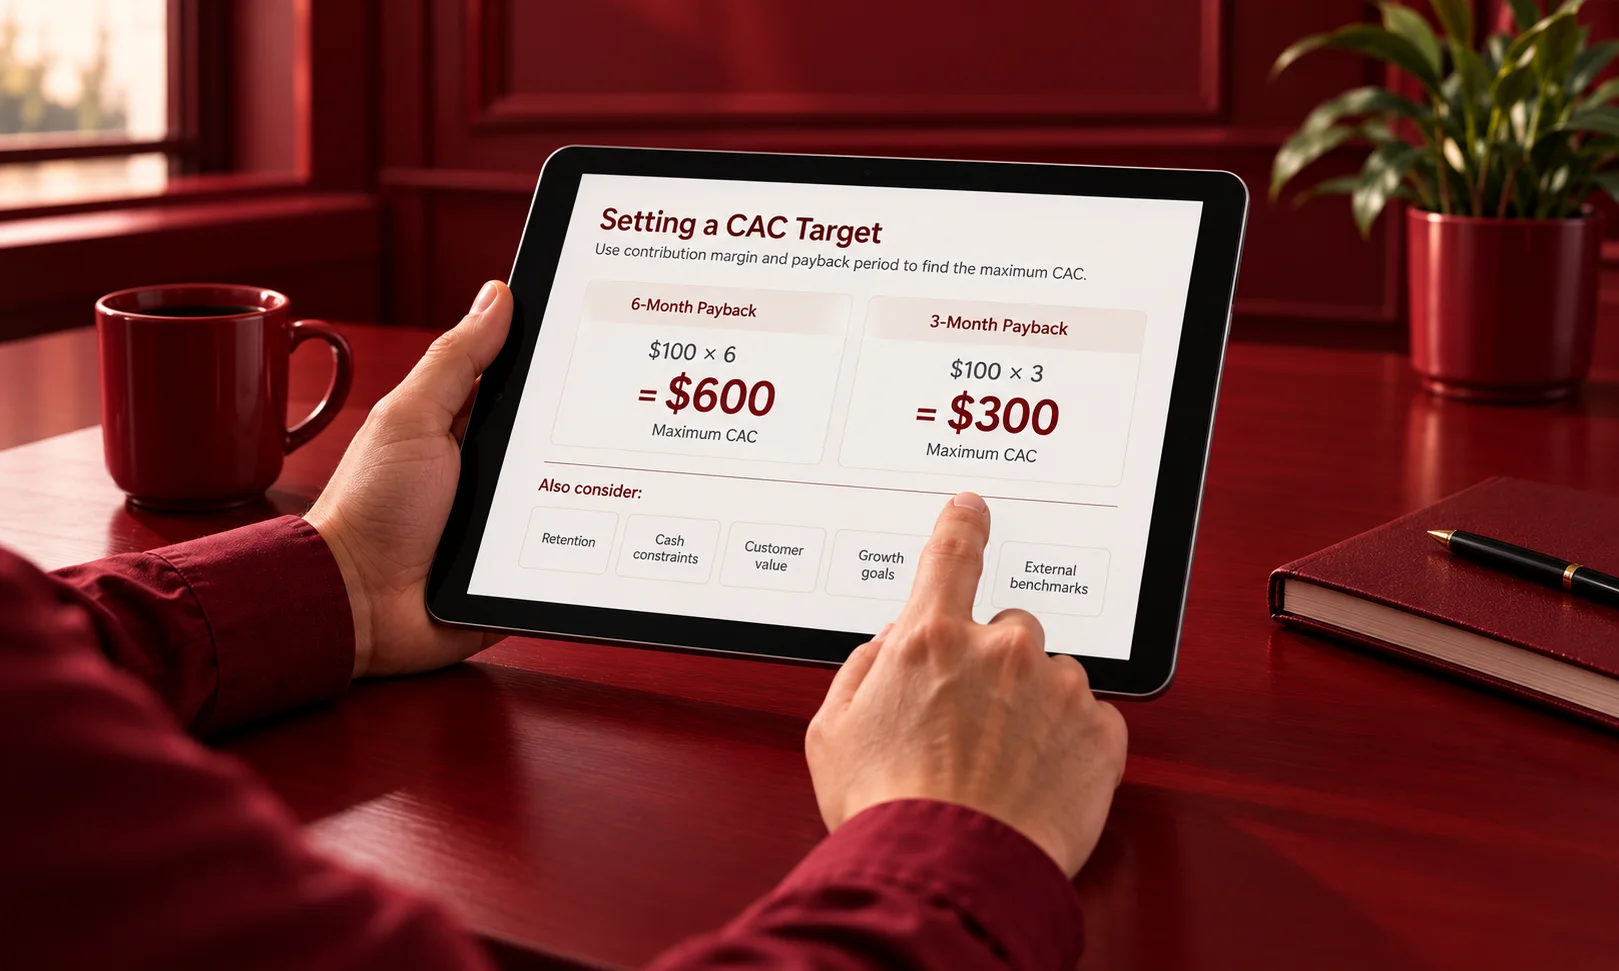
Start with the contribution margin you expect from a new customer and the payback period the business can fund. Suppose a business generates $100 in monthly contribution margin per customer and wants to recover acquisition cost within six months. The simple ceiling is:
$100 × 6 = $600 CAC
Now suppose the business can only fund a three-month payback:
$100 × 3 = $300 CAC
The $300 or $600 figure is not automatically the target. It is the maximum implied by that simple payback assumption. The team still needs to account for retention, cash constraints, customer value and growth goals. Then bring in the external benchmark.
If a published industry figure says $700 but your economics support only $300, do not simply raise the target because the market number is higher. The gap tells you that the business may need better conversion, a stronger offer, better retention, a different channel mix or another economic improvement.
That is how you defend a CAC target: start with what the business can fund, then use external data as context.
Five checks before you quote a published CAC figure
1. Who published it?
Identify the publisher and understand why the dataset exists. A benchmark created for a specific commercial audience may use a particular sample or methodology.
2. What was the sample?
Check the number of companies, customers or accounts and the markets they represent. A dataset of B2C companies should not automatically become a target for enterprise software.
3. Which CAC definition did they use?
Look for paid, blended, organic, inorganic, fully loaded or channel-specific CAC. This is the most important check. If the definition is missing, the number should not enter your benchmark table.
4. Which year does it cover?
CAC changes as media costs, competition, conversion rates and buying behavior change. A 2021 number should not quietly become a 2026 planning target.
5. Is it a median or a mean?
A mean can move sharply when a small number of companies have unusually high acquisition costs. A median can give a better picture of the middle of a dataset. But even a median cannot fix a weak sample or an unclear definition.
The Read
External CAC data is useful, but it should not get the final vote on what your business can spend. The problem is not that every published number is wrong. The problem is that CAC is not one universal metric. A paid B2C CAC, an inorganic B2B CAC and a fully loaded company-wide CAC can all be valid measurements while describing very different acquisition systems.
Use CAC benchmarks to understand the market, challenge your assumptions and give a growth discussion some outside context. Do not use them to decide what your business can afford. This week, calculate one clean CAC number for your own business. Write down exactly what goes into it, keep that definition fixed and track it alongside payback and customer value. That gives you a benchmark you can actually defend.
Frequently Asked Questions
What is a good customer acquisition cost?
A good CAC is one your business can recover within its acceptable payback period while leaving enough contribution margin to support profitable growth. The right number depends on customer value, retention, margin, purchase frequency and the amount of cash the business can commit to acquisition.
How is CAC calculated?
The basic formula is acquisition spend divided by new customers acquired during the same period. The important part is defining acquisition spend. Paid CAC, blended CAC and fully loaded CAC can produce very different results, so the definition should stay consistent when you compare periods or benchmarks.
What is the difference between blended and paid CAC?
Blended CAC includes broader acquisition spending across channels and divides it by new customers. Paid CAC focuses on paid acquisition spending and the customers attributed to those channels. A paid CAC should not be compared directly with a blended CAC without first adjusting for the different definitions.
What is a good lifetime value to CAC ratio?
A 3:1 LTV: CAC ratio is a commonly used SaaS rule of thumb, but it is not a universal requirement for every category. The useful ratio depends on margins, retention, payback, growth goals and how accurately lifetime value is being estimated.
Why are published CAC benchmarks unreliable?
The main problem is comparability. Reports can use different CAC definitions, samples, channels, customer types, years and attribution methods. A published number becomes much more useful when its definition and population closely match your own business.
How do you set a CAC target?
Start with contribution margin and the payback period the business can fund. Work backward to establish the CAC boundary, then compare it with external benchmarks. If the external number is higher than your economic limit, improve the acquisition system rather than simply adopting the market figure.
Sources
- First Page Sage: Average Customer Acquisition Cost by Industry, B2C Edition — B2C paid and organic CAC data.
- First Page Sage: Average Customer Acquisition Cost by Industry, B2B Edition — 2026 B2B inorganic, organic and combined CAC data.
- ChartMogul: CAC Payback Period — Current SaaS payback definitions and SMB/enterprise guidance.