

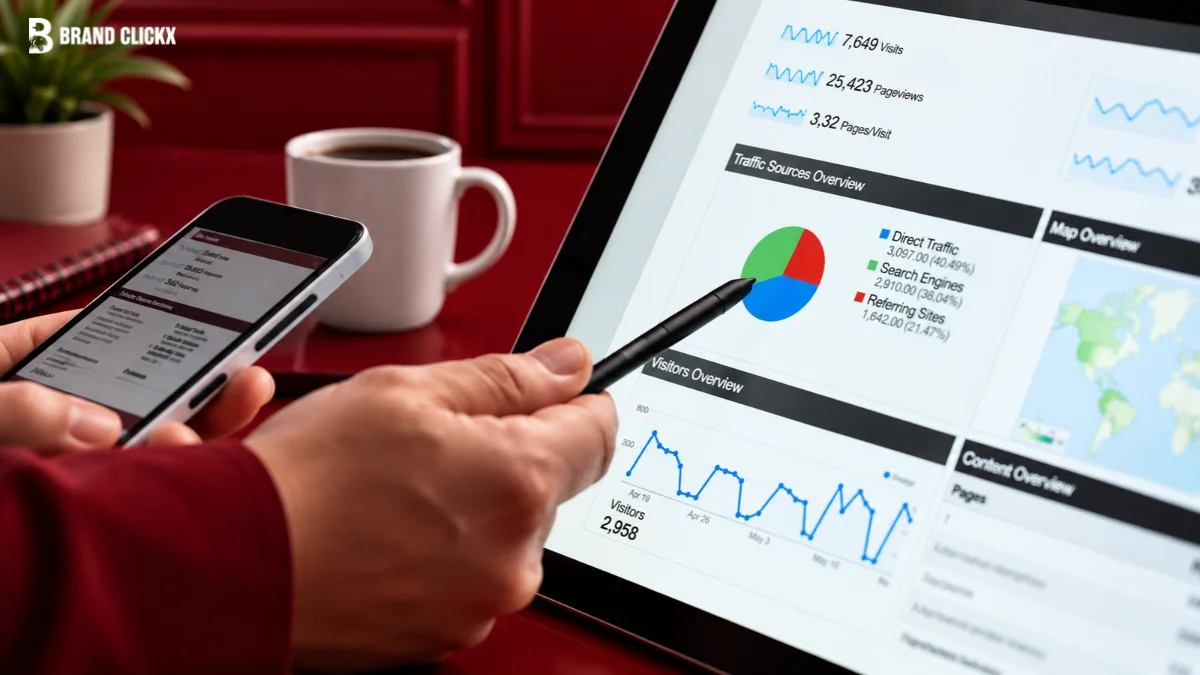
Someone puts a benchmark on the screen and says, “Our CPA is 30% above the industry average.” That sounds useful until you ask one question: Which industry, which campaign objective, which country and which conversion?
That is the problem with paid social benchmarks. They can help you understand the market, but they cannot tell you whether your account is healthy on their own. Published numbers mix different audiences, budgets, objectives, attribution settings and seasons. A useful benchmark gives you a range and explains the conditions behind it.
This guide gives you both. Where current data supports a useful comparison, you will see the range. When public data doesn’t support a clean comparison, the table says so instead of filling the gap with a number that looks more certain than it is.
Key Takeaways
- CPM, CTR, CPC and CPA only become useful when you know the campaign objective, geography, audience and measurement method.
- Different datasets use different samples, objectives and time periods, so published numbers can answer different questions.
- Build a rolling median using several months of data and separate campaigns by objective and important variables.
- Creative volume, the offer, landing page, conversion event and budget relative to audience size can all move paid social costs.
- When presenting a benchmark, show the source, year, sample and metric definition, then compare it with your own trailing performance.
What a paid social benchmark actually measures

A benchmark is only useful when you know exactly what the metric measures.
CPM
Cost per thousand impressions (CPM) tells you what you pay to deliver 1,000 impressions. It is one of the easier paid social metrics to compare because it gives you a view of auction costs. It still changes with geography, audience size, season and competition. So even CPM needs context.
CTR
Click-through rate (CTR) shows how often people click after seeing an ad. It gives you a useful read on how the audience responds to the creative. However, CTR becomes harder to compare when campaign objectives differ. A traffic campaign is built to generate clicks while a lead campaign is built around leads.
CPC
Cost per click (CPC) combines the cost of impressions with how often people click. Current campaign data shows a clear difference between objectives, with traffic campaigns producing a much lower average CPC than lead campaigns. That does not mean one objective has cheaper advertising. It means the two campaigns are trying to produce different actions.
CPA
Cost per acquisition (CPA) is much harder to compare. One advertiser may count a completed purchase while another counts a lead, trial or app install. That is why CPA travels poorly between accounts. The conversion has to mean roughly the same thing before the number becomes useful.
ROAS
Return on ad spend (ROAS) can also mislead if the underlying revenue rules differ. Attribution windows, margins, repeat purchases and customer value can make two identical ROAS figures mean very different things. So the basic rule is simple: CPM can travel reasonably well. CPA usually cannot.
Why published benchmarks disagree so much
The samples are different:
A benchmark based on tens of thousands of ecommerce brands does not describe the same market as a benchmark based on a smaller group of US campaigns.
Current data illustrates the difference. One large Meta dataset covers more than 40,000 brands from August 2025 through July 2026. Another 2026 benchmark study covers almost 1,800 campaigns and separates traffic and lead objectives. Neither dataset needs to be “wrong.” They answer different questions.
Objectives change the number:
A campaign trying to generate cheap clicks can produce a very different CPC from one trying to generate qualified leads. The same applies to CPA. A purchase campaign and a lead-generation campaign should not share the same benchmark simply because both use the word “conversion.”
Geography matters:
A US benchmark should not become a global target without adjustment. Audience costs, competition, purchasing power and market size all change by region. A campaign aimed at a broad US audience is not directly comparable with one targeting a narrow audience in another country.
Seasonality changes the auction:
Paid social costs can move throughout the year as more advertisers compete for the same inventory. Retail, travel and other seasonal categories can see especially large changes. A benchmark without a date therefore leaves out an important part of the story.
The publisher matters:
A useful benchmark should tell you who collected the data, when it was collected, how many accounts or campaigns it covered and what those accounts had in common. If those details are missing, treat the number as directional rather than as a planning target.
Paid social benchmarks by vertical
This is where benchmark articles often create false confidence. The market does not currently offer one clean 2026 dataset that covers every requested vertical with comparable CPM, CTR and CPA figures. The table therefore separates published ranges from metrics that lack a defensible comparable range.
| Vertical | Typical CPM range | Typical CTR range | Typical CPA range | Main thing that moves the number |
| Ecommerce and retail | 11.50–21.80 | Not available as a comparable vertical range | 26.80–51.86 | Product value, creative and purchase rate |
| B2B software | No defensible public range | No defensible public range | No defensible public range | Audience size, lead quality and sales cycle |
| Finance and insurance | No defensible public range | 1.46% traffic CTR | No comparable CPA range | Audience restrictions, competition and lead value |
| Health and wellness | No defensible range | 1.86% traffic CTR | $40.53 median CPA* | Competition, targeting and conversion rate |
| Travel | $16.34* | 2.28% traffic CTR | No comparable CPA range | Seasonality, destination and booking value |
| Education | $14.05* | 1.50% traffic CTR | $26.31 CPL* | Offer, lead quality and enrollment rate |
| Apps and gaming | No defensible public range | No defensible public range | No defensible public range | Install value and optimization event |
| Local services | No defensible public range | 1.93% traffic CTR | $38.09 CPL* | Service value, geography and local competition |
* These figures are reported medians or campaign metrics from specific datasets, not universal vertical ranges. They provide context and should not be treated as directly interchangeable.
The ecommerce range comes from a large Meta dataset covering 17 ecommerce categories. Its median CPMs ranged from $11.50 in Baby to $21.80 in Health & Wellness. Median CPAs ranged from $26.80 in E-learning & Online Courses to $51.86 in Electronics and Medical Devices & Equipment.
The other figures come from a separate US campaign dataset. That study reports traffic and lead campaign results separately, which is why the table uses CTR and CPL where those are the available measures instead of pretending they are purchase CPAs.
So, what is a good CPM on paid social? There is no universal answer. Current ecommerce data puts the median CPM across its full sample at $15.06, but individual categories sit materially above and below that level. A CPM only becomes useful when you connect it to the audience, objective, geography, CTR, conversion rate and value of the action you are buying.
What actually drives the differences between verticals
Auction competition

Paid social works through an auction. Advertisers compete for available impressions and the delivery system considers more than the amount an advertiser is willing to pay. That means two brands targeting similar people can still see different costs because their creative, predicted action rates, audience signals and overall ad quality differ.
The value of a conversion
A $50 CPA does not mean the same thing for every business.
If one company earns $500 from a new customer and another earns $50, their acceptable acquisition costs can be very different. This is why an expensive vertical is not automatically inefficient. The business model has to support the cost.
Audience size
A narrow audience gives the system fewer people to reach. That can increase repetition and put more pressure on delivery. Audience signals also matter because the platform uses information about likely user actions when deciding where to deliver ads.
Creative fatigue
Creative can change the economics of a campaign. When people see the same creative too often, response can weaken and the cost of getting the desired action can rise.
This makes creative refresh rate an important part of benchmark analysis. A rising CPA may have less to do with your industry and more to do with an audience seeing the same message too many times.
Seasonality and bidding strategy
Seasonality can change the amount of competition in an auction. Your bidding strategy also affects how the platform tries to spend the available budget. That is why a benchmark should never be separated from the period and campaign setup that produced it.
Five things that move your numbers more than your vertical does
1. Creative quality and volume
A strong vertical benchmark cannot rescue weak creative. Creative volume matters because one asset rarely stays fresh forever. Testing different hooks, formats and messages gives you more ways to find what the audience responds to.
2. The offer
A weak offer can make a cheap click expensive at the business level. You can have a low CPM and healthy CTR while still getting poor results because the product, price, promotion or message does not give people a strong reason to convert.
3. The landing page
The ad controls only part of the journey. If the ad creates a strong expectation and the landing page fails to deliver it, the campaign can generate good CTR but poor conversion rates. That makes CPA look like an advertising problem when the friction sits after the click.
4. The conversion event
Optimizing for a cheap action does not guarantee cheap customers. A campaign optimized for clicks will produce a different result from one optimized for leads or purchases. That is why comparing CPC or CPA without checking the optimization event can lead you in the wrong direction.
5. Budget relative to audience size
A large budget pushed into a small audience can create repetition quickly. A larger audience gives the system more room to find people who respond. This connects directly to creative fatigue. Repeated exposure can weaken response, which means rising costs may reflect the way you are managing creative rather than the vertical you operate in.
Your own creative refresh rate may therefore tell you more about rising costs than the industry label sitting in your campaign report.
How to build your own baseline instead
Your account already contains a benchmark. You just need to build it properly.
1. Pull enough history
Start with several months of stable data. Twelve months is useful when seasonality has a large effect because it lets you compare similar periods.
2. Use the median
Calculate the median CPM, CTR, CPC and CPA instead of relying only on the average.
The median reduces the effect of unusually large or expensive campaigns. It gives you a better view of what a typical result looks like inside your own account.
3. Split by objective
Keep traffic, lead generation, purchase and app campaigns separate. Do not create one “paid social average” and expect it to explain everything.
4. Segment the important variables
Separate major geographies, prospecting and remarketing where relevant and major campaign objectives. You can then add product category, audience type or placement when those differences materially affect performance.
5. Refresh it monthly
Keep a rolling median instead of replacing the benchmark every time a new campaign launches. This creates a living baseline. You can compare the current period with your own recent history and then use an external benchmark for additional context. That is much more useful than saying, “The industry average is $X.”
How to use a benchmark in a meeting without getting caught out

A benchmark should enter the meeting with its label attached. State the source, year, sample and metric definition before using the number.
Instead of saying: “The industry CPA is $40. Say: “This dataset reports a median CPA of $40 across its sample during a defined period, so I am using it as context rather than a target.” Then explain what could push your account above or below it. That might include geography, audience size, campaign objective, offer, conversion rate, seasonality or creative fatigue.
Also show your own trailing median beside the external figure. That gives the room two useful views: where the wider market sits and where your account has actually been performing. Do not quote a single figure with no methodology and then use it to defend a result after the fact.
The read
Publish industry benchmarks, but only when you provide enough context for readers to understand what the numbers represent. The current data makes that clear. Large datasets can produce useful market context, but different datasets use different populations, objectives and measurements. A Meta ecommerce benchmark cannot automatically become the target for a B2B lead campaign.
The useful benchmark is therefore not one number. It is a number plus its conditions. This month, set up a rolling median for your own CPM, CTR, CPC and CPA by objective. Keep seasonality visible and refresh it monthly. Then use outside paid social benchmarks as context rather than as a target.
Frequently Asked Questions
What is a good CPM on paid social?
There is no single good CPM. Current ecommerce data shows meaningful differences between categories, while other campaign datasets measure different objectives. Judge CPM alongside CTR, conversion rate, customer value, audience size and seasonality rather than against one universal target.
What is a good cost per acquisition on Facebook ads?
A good CPA depends on what counts as an acquisition and how much that customer is worth. A purchase CPA, lead cost and app install cost are different metrics. Start with your own historical CPA and compare it with a benchmark using the same conversion definition.
Why do paid social benchmarks vary so much between reports?
Reports use different samples, objectives, countries, time periods and measurement methods. One current dataset covers more than 40,000 ecommerce brands while another covers almost 1,800 campaigns split between traffic and lead objectives. Their numbers answer different questions.
Should you compare your results to industry benchmarks?
Yes, but use them as context rather than a pass-or-fail test. First compare your results with your own trailing baseline. Then use an external benchmark to understand whether wider market conditions could help explain the difference.
How do you build your own paid social baseline?
Use several months of stable data and calculate a rolling median for each major objective. Segment the data by important variables such as geography and campaign goal. Refresh the baseline monthly and keep seasonal periods separate when they materially change costs.
Which verticals have the highest CPMs?
It depends on the dataset and the verticals it covers. In one large 2026 ecommerce dataset, Health & Wellness had a median CPM of $21.80 while Baby had $11.50. That dataset covers ecommerce categories, so it should not be treated as a ranking of every paid social vertical.
Can you use Facebook ads CPA benchmarks for any paid social campaign?
Not automatically. A Facebook benchmark becomes more useful when the platform, objective, conversion event, geography and measurement method are similar to yours. If those conditions differ, use the number as directional context and rely more heavily on your own account baseline.
Sources
- Triple Whale: Facebook Ad Benchmarks by Industry, 2026
Covers 40,000+ brands and provides 2026 Meta CPM, CPA, CTR and conversion data by ecommerce vertical. - WordStream: Facebook Ads Benchmarks 2026
Covers almost 1,800 Meta ad campaigns, with separate traffic and lead campaign benchmarks. - Triple Whale: Ads Benchmarks and Peer Data
Explains how benchmark comparisons can use peer groups rather than generic industry averages.