


Imagine you run a CTV campaign across 3 streaming platforms.
Platform A says it reached 4 million people. Platform B says it reached 3 million. Platform C says it reached another 3 million.
It sounds like you reached 10 million people.
But what if many of those people watched your ads on all 3 platforms?
That is the problem with CTV measurement. Each platform can tell you how many people it reached, how often they saw the ad, and how many impressions it delivered. But those platforms do not always have a shared view of the same audience. So the same viewer can appear in several reports.
CTV was supposed to give advertisers the best of television and digital advertising. Instead, buyers often get good data from each platform but a weak picture of the campaign as a whole.
The biggest CTV measurement problem is simple: platforms can control frequency inside their own system, but they cannot always control how often the same person sees the ad across the whole campaign.
Key Takeaways
- You cannot simply add the reach numbers from different CTV platforms.
- The same viewer can be counted by several platforms.
- A frequency cap on one platform does not automatically apply to other platforms.
- Overlapping audiences can receive far more ads than the buyer intended.
- Buyers should ask for unduplicated reach, frequency distribution, and incremental reach.
What CTV Was Supposed to Be

CTV looked like a perfect combination.
Television offered large audiences and premium content. Digital advertising offered targeting, flexible buying and detailed reporting.
CTV promised to bring these things together.
CTV combines TV’s large audiences with digital targeting and reporting. Effective marketing performance measurement helps advertisers understand campaign results across streaming platforms.
But there is one big problem.
Better data inside each platform does not mean better data across all platforms.
A campaign may run on YouTube, Netflix, Amazon, and several other streaming services. Each platform can report what happened on its own service.
The problem starts when the same person watches the campaign on more than one platform.
The buyer then has several accurate reports, but no simple way to combine them into one accurate picture.
Why CTV Reach Numbers Do Not Add Up
The easiest way to understand the problem is to think about 2 streaming platforms.
Imagine Platform A says it reached 1 million viewers.
Platform B also says it reached 1 million viewers.
It would be wrong to automatically say the campaign reached 2 million unique viewers.
Some of the people on Platform A may also use Platform B.
This is why streaming reach measurement is not just about counting viewers. It is also about finding out how many of those viewers are actually different people.
Public research shows that this overlap can be large.
Comscore’s 2022 CTV Intelligence research found a 66% audience overlap between Netflix and Amazon Video and a 66% overlap between Netflix and YouTube. The research looked at US streaming audiences and was published as industry audience research by Comscore.
That does not mean every campaign will have a 66% overlap. Different audiences, platforms, and campaigns will produce different results.
But it proves an important point: streaming audiences are not separate boxes.
There is another complication: co-viewing.
Co-viewing happens when more than one person watches the same screen at the same time. Nielsen reported in 2024 that 47% of linear and CTV viewing in its measurement was consumed by more than one person at a time.
So even the question “How many people saw this ad?” can become complicated.
A platform may know that an ad was shown on one connected TV. But that screen may have been watched by 1 person, 2 people or an entire family.
This makes CTV reach harder to calculate than simply counting devices or impressions.
The Frequency Arithmetic
This is where the problem becomes very easy to see.
Imagine a campaign running on 3 CTV platforms.
Each platform sets a frequency cap of 3 ads per viewer per week.
That sounds reasonable.
But the cap only applies inside that platform.
| Platform | Weekly cap | Possible exposures |
| Platform A | 3 | 3 |
| Platform B | 3 | 3 |
| Platform C | 3 | 3 |
| Same viewer on all 3 | 3 each | 9 |
A viewer who uses all 3 platforms could therefore see the same campaign up to 9 times in one week.
The buyer did not necessarily make a mistake.
Each platform followed its own 3x frequency cap.
The problem is that the caps were not connected.
This is why ctv frequency capping is different from campaign-level frequency capping.
A 3x cap on Platform A does not know that the same viewer has already seen the ad 3 times on Platform B.
The public Comscore research mentioned earlier makes this concern realistic. It found 66% audience overlap between Netflix and Amazon Video and 66% between Netflix and YouTube. However, Comscore did not publish a reliable 3-way overlap figure for all 3 services. So it would be misleading to invent one.
The safer way to look at the problem is through the exposure itself:
3 platforms × 3 exposures = up to 9 exposures for a viewer who belongs to all 3 audiences.
That is the cross-platform frequency problem.
And it explains why a campaign can have a reasonable average frequency while some viewers are seeing the ad far more often.
Where the Waste Actually Happens
The waste is not simply “too many ads.”
The bigger problem is that the ads may not be spread evenly across the audience.
Some viewers may see the campaign once or twice.
Others may see it again and again because they use several of the platforms being bought.
This creates 2 problems.
First, the advertiser spends more money showing ads to people who were already reached.
Second, money that could have reached new viewers is used to show more ads to the same people.
Platforms may report millions of viewers, but their audiences can overlap. Data-driven content and advertising decisions help marketers understand campaign performance and avoid wasted spending.
Platform A can say:
“We reached 2 million people.”
Platform B can say:
“We reached 2 million people.”
Platform C can say:
“We reached 2 million people.”
All 3 statements can be true.
But they do not tell the buyer how many unique people the campaign reached.
This does not require platforms to do anything wrong.
Platform A cannot automatically see everything that happened on Platforms B and C.
So every platform reports the part of the campaign it can see.
The waste sits in the gap between those reports.
What Measurement Options Actually Exist?
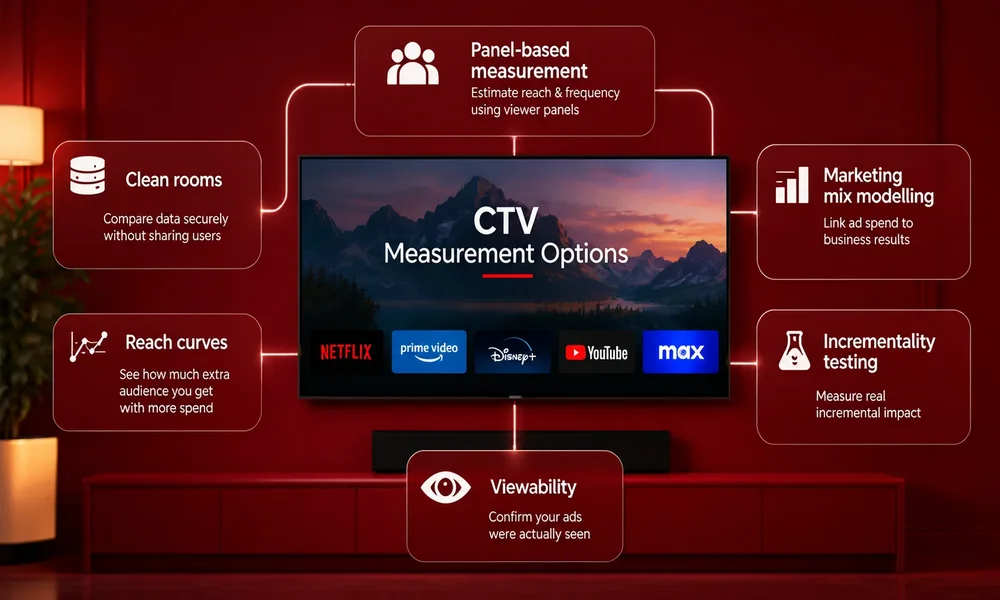
There is no single solution that completely fixes cross-platform CTV measurement today.
Instead, buyers have several options.
Panel-based measurement
A measurement company can use a panel of viewers to estimate who watched content and how often.
This gives buyers a more independent view than relying only on one platform’s own report.
The downside is that a panel is a sample of the population, not every viewer.
Clean rooms
Clean rooms allow companies to compare audience data without directly sharing individual user information.
For example, 2 companies can work in a secure environment to find out how many records overlap.
Snowflake’s clean-room documentation describes tools for calculating audience overlap between 2 parties without exposing the underlying individual records.
This can help answer an important question:
How many of the people I reached on Platform B were already reached on Platform A?
But clean rooms are not magic.
The relevant platforms have to participate, agree to the process, and provide usable data.
Reach curves
Reach curves show how much additional audience a buyer gets as more money is spent.
This is useful because the first $100,000 might reach many new people.
The next $100,000 might reach fewer.
Eventually, most of the new spend may simply create more frequency among people already reached.
Innovid’s 2022 CTV research found that campaigns using fewer publishers produced higher average unique reach than campaigns spread across more publishers.
Marketing mix modelling
Marketing mix modelling looks at the relationship between advertising spend and business results. It can help answer: “Did increasing CTV spending actually contribute to more sales?” That is useful, but it does not tell you exactly which individual viewer saw the same ad 8 times.
For a more direct assessment of campaign impact, incrementality testing can help determine whether advertising generated additional results that would not have happened otherwise.
Incrementality testing
Incrementality testing asks an even more useful question:
Did the advertising create additional results that would not have happened anyway?
This can be tested through holdout groups or different geographic markets.
Finally, there is viewability.
An ad being delivered does not automatically mean it was properly seen. CTV measurement therefore also needs good standards for determining whether an ad was actually viewable.
IAB Tech Lab’s 2025 CTV Programmatic Guide discusses standardized measurement signals, including Open Measurement, to improve consistency in CTV advertising.
None of these methods completely solves the cross-platform problem.
Together, however, they can give buyers a much better picture.
What a Buyer Can Actually Do
Here are 5 practical steps.
1. Use fewer platforms when possible
More platforms do not automatically mean more reach.
If several platforms are reaching the same people, adding another platform can simply increase frequency.
The goal should be incremental reach, not the largest possible platform list.
2. Ask for reach curves
Do not only ask:
“How many people will this campaign reach?”
Ask:
“How much new reach do we get from the next $100,000?”
If the answer keeps getting smaller, the campaign is reaching the same audience more often.
3. Use a clean room for large campaigns
If the campaign is large enough to justify the effort, ask whether the platforms can provide a clean-room audience match.
You do not need individual user data.
You need to know how much of your audience overlaps and how much reach is actually new.
4. Run an incrementality test
Do not judge the campaign only by impressions and clicks.
Run an incrementality testing experiment where possible.
For example, compare similar markets where one receives the campaign and another does not.
This helps answer whether CTV actually created additional business results.
5. Set lower caps when overlap is high
A 3x cap on 3 different platforms does not mean the campaign has a 3x cap.
For a viewer who appears on all 3 platforms, it could become 9 exposures.
Buyers should also consider curated marketplaces, more controlled supply paths, and supply path optimization when they need greater visibility into where their CTV inventory is coming from. Evaluating buying routes alongside reach, viewability, and media quality can help advertisers make more informed decisions about where their budgets go.
The most useful request to make is simple:
Show me unduplicated reach, frequency distribution and incremental reach not 3 separate platform reports.
That is the information buyers actually need.
The Read
Cross-platform CTV measurement will probably improve, but it will not happen simply because more dashboards become available.
The platforms need to make it easier for buyers to understand how their audiences overlap.
Industry groups are already pushing for more consistent measurement standards. IAB published a standardized CTV measurement guide in 2025, showing that the industry recognizes the problem.
But buyers should not wait for a perfect solution.
The biggest mistake today is assuming that a frequency cap on each platform automatically protects the whole campaign.
It does not.
At the next CTV planning meeting, ask one question: “How much new reach are you adding after the audience we’ve already bought elsewhere?”
If a platform cannot answer that, you do not really know whether the next dollar is finding a new viewer or showing the same viewer another ad.