


A team has rebuilt its cancellation flow three times. It added save offers, changed the copy, moved the button, and tested a new survey. Yet the churn number barely moves.
That is not surprising if the cancellation page is where the business is looking, rather than where the customer’s decision was formed. A subscriber can spend weeks deciding that a product is not useful enough, arrives too often, costs more than expected, or simply no longer fits their routine before they ever click Cancel.
Good subscription churn reduction therefore starts earlier. The useful question is not “How do we stop this cancellation?” but “At what point in the lifecycle did this customer become likely to leave?” Organizing retention work around that sequence changes what gets measured, what gets fixed, and how quickly a team can expect results.
Key Takeaways
- Measure churn by cohort and by voluntary versus involuntary cause before changing the cancellation flow.
- The first delivery, first use, and second renewal can reveal problems that a cancellation survey only reports after the fact.
- Failed-payment recovery is often a faster operational fix than changing the product.
- Pause, skip, and frequency controls can preserve a relationship without forcing every customer into a discount.
- A flattening retention curve is often more useful than chasing an arbitrary “good” churn number.
Screenshot-Worthy Churn Framework
| Lifecycle point | Primary signal | First intervention | Watch |
| Sign-up | Offer mismatch | Clarify promise | Early churn |
| First use | Low activation | Guided onboarding | Usage |
| Delivery | Service failure | Fix reliability | Renewal |
| Renewal | Payment failure | Retry + recovery | Recovery rate |
| Plan change | Price shock | Explain + offer choice | Renewal |
| Cancellation | Stated reason | Save, pause, or exit | Save rate + reasons |
Measure It Properly Before You Touch Anything: Subscription Churn Reduction Starts With Cohorts
Start by separating three things that are often collapsed into one headline number.
Gross churn is the share of subscribers lost during a period. Net churn can include other movements depending on the business’s definition, so document the formula rather than use the term loosely. More importantly, separate voluntary churn from involuntary churn.
Voluntary churn is an active decision to leave; involuntary churn happens when a payment failure ends the subscription. Recurly benchmarks these separately. Its July 2026 network data reports median annual churn of 3.60%, including 2.34% voluntary and 1.25% involuntary. These are network benchmarks, not universal targets.
Then look beyond monthly churn. One monthly percentage can hide very different signup cohorts, acquisition sources, or first-renewal behavior. Cohort analysis groups customers by signup period and follows that same group as it ages. That is what retention cohorts are for.
Build a cohort retention curve with signup cohorts on the rows, months or renewal cycles on the columns, and the percentage still active at each point. Split it by acquisition source, plan, product, and first-order offer where volume allows. The first sharp drop tells you where to investigate; the later flattening shows which customers have become durable.
Where Churn Is Actually Decided
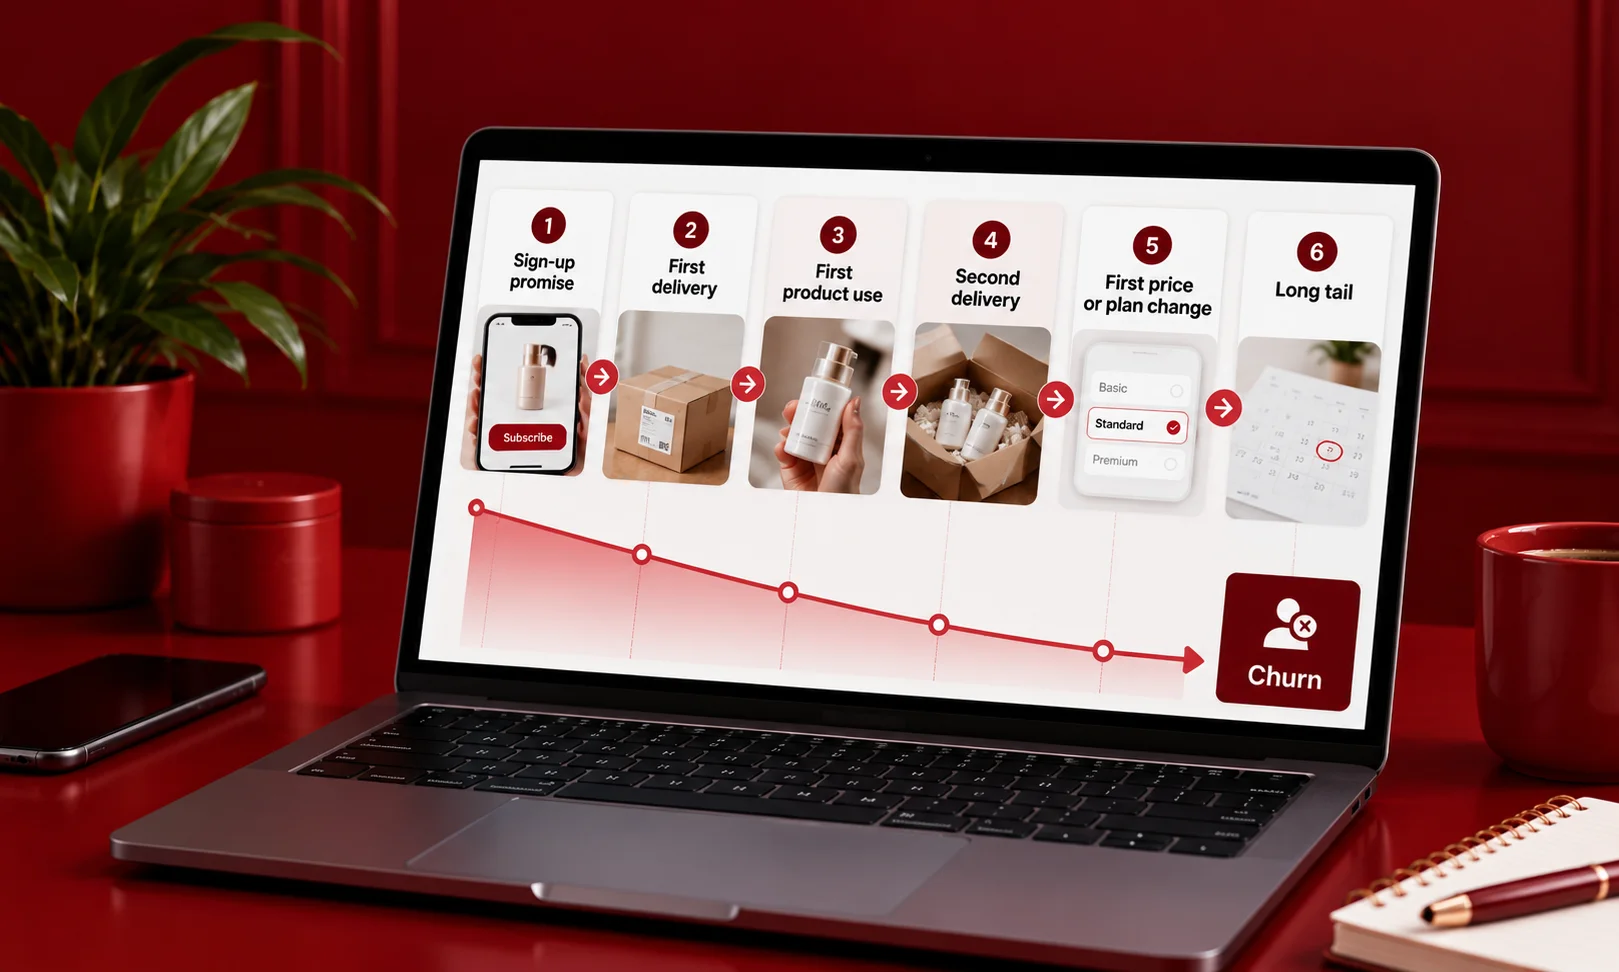
Think of the lifecycle as a chain of decisions rather than a single cancellation event.
- Sign-up promise. Churn can begin when the offer creates an expectation the product cannot meet. Measure conversion rate, offer type, promised benefit, and early cancellation by acquisition source.
- First delivery. Late shipment, confusing packaging, damage, or a weak first impression can turn a good purchase into a poor subscription experience. Measure delivery time, support contacts, refunds, and renewal after the first cycle.
- First product use. This is where perceived value becomes real. If customers cannot use the product easily or do not experience the promised benefit, later retention work is playing catch-up. Measure activation or usage and compare it with second-cycle renewal.
- Second delivery. The second cycle tests whether the subscription has become habitual. Measure second-order retention, skips, product ratings, and changes in usage.
- First price or plan change. Price increases, quantity changes, or plan switches create a fresh value calculation. Zuora’s 2025 Subscription Economy Index found 47% of consumers who canceled a subscription in 2024 cited price increases, based on a Harris Poll of more than 3,000 U.S. adults commissioned by Zuora. That is survey evidence, not a universal ecommerce attribution.
- Long tail. Later churn can follow a routine change, seasonality, or declining use. Watch reactivation, pauses, frequency changes, and long-term cohort curves.
The allocation problem is the key to subscription churn reduction. Cancellation screens are visible and easy to A/B test. Earlier lifecycle problems are harder to isolate, but they can affect more customers.
Involuntary Churn: The Cheapest Win Available
A failed renewal does not necessarily mean a customer wanted to leave. Cards expire. Payment credentials change. Banks decline transactions. Funds may be temporarily unavailable. A subscription can therefore disappear even when the underlying customer relationship is still intact.
That is the practical difference between voluntary and involuntary churn: intent. The customer actively chooses to cancel in the first case; the billing system loses them in the second.
This is why payment recovery belongs near the front of a churn program. Stripe says 25% of lapsed subscriptions in its analysis were purely due to payment failures, while its Smart Retries research found recovered subscribers continued for an average of 7 more months. These are Stripe’s own network and product figures, so treat them as vendor evidence, not a universal ecommerce benchmark.
The operating checklist is simple: monitor decline reasons, use appropriate retry timing, update expired card details where supported, send clear payment-update prompts, and measure recovery by failure type. Recurly’s July 2026 network data also shows involuntary churn varies by category and ARPC.
For churn prevention ecommerce, this is attractive because the intervention removes a payment obstacle rather than asking a dissatisfied customer to stay.
The Interventions, Organized by Where They Act
At sign-up, fix the promise before adding a save offer. Make cadence, price, renewal terms, quantities, and cancellation conditions clear. Watch early-cycle churn by offer and acquisition source. Results can appear within one or two renewal cycles.
During onboarding and first use, help customers reach value quickly. For physical products, that may mean usage instructions, reminders, recipes, or routines; for digital subscriptions, it may mean reaching a core action. Watch activation, usage, support contacts, and first-to-second-cycle retention. Expect several weeks for a cohort signal.
At delivery, reliability is retention infrastructure. Track late shipments, stockouts, failed deliveries, refunds, and churn after service incidents. Operational fixes can take longer than copy tests, but the signal can be strong when churn clusters around delivery failures.
Next comes flexibility. Pause, skip, and frequency changes let customers adjust the relationship without ending it. Recurly’s 2026 State of Subscriptions, which analyzed more than 2,200 subscription businesses and 76 million subscribers alongside consumer research, reports that 38% of consumers prefer pausing over canceling and that brands offering pause saw pause usage rise 337%. These are Recurly’s own 2026 figures, so treat them as directional vendor evidence, not a universal effect size.
For price or plan changes, test transparency and alternatives before defaulting to discounts. Watch renewal conversion, average order value, downgrade or pause rates, and margin impact. This is where conversion rate optimisation meets unit economics.
Finally, the cancellation flow has a legitimate role. A clear reason selector, relevant alternative, pause option, and honest offer can save some customers. It should be a recovery and diagnostic point, not the whole churn strategy. Subscription retention does not require making cancellation difficult.
The Tactics That Look Good and Do Not Work
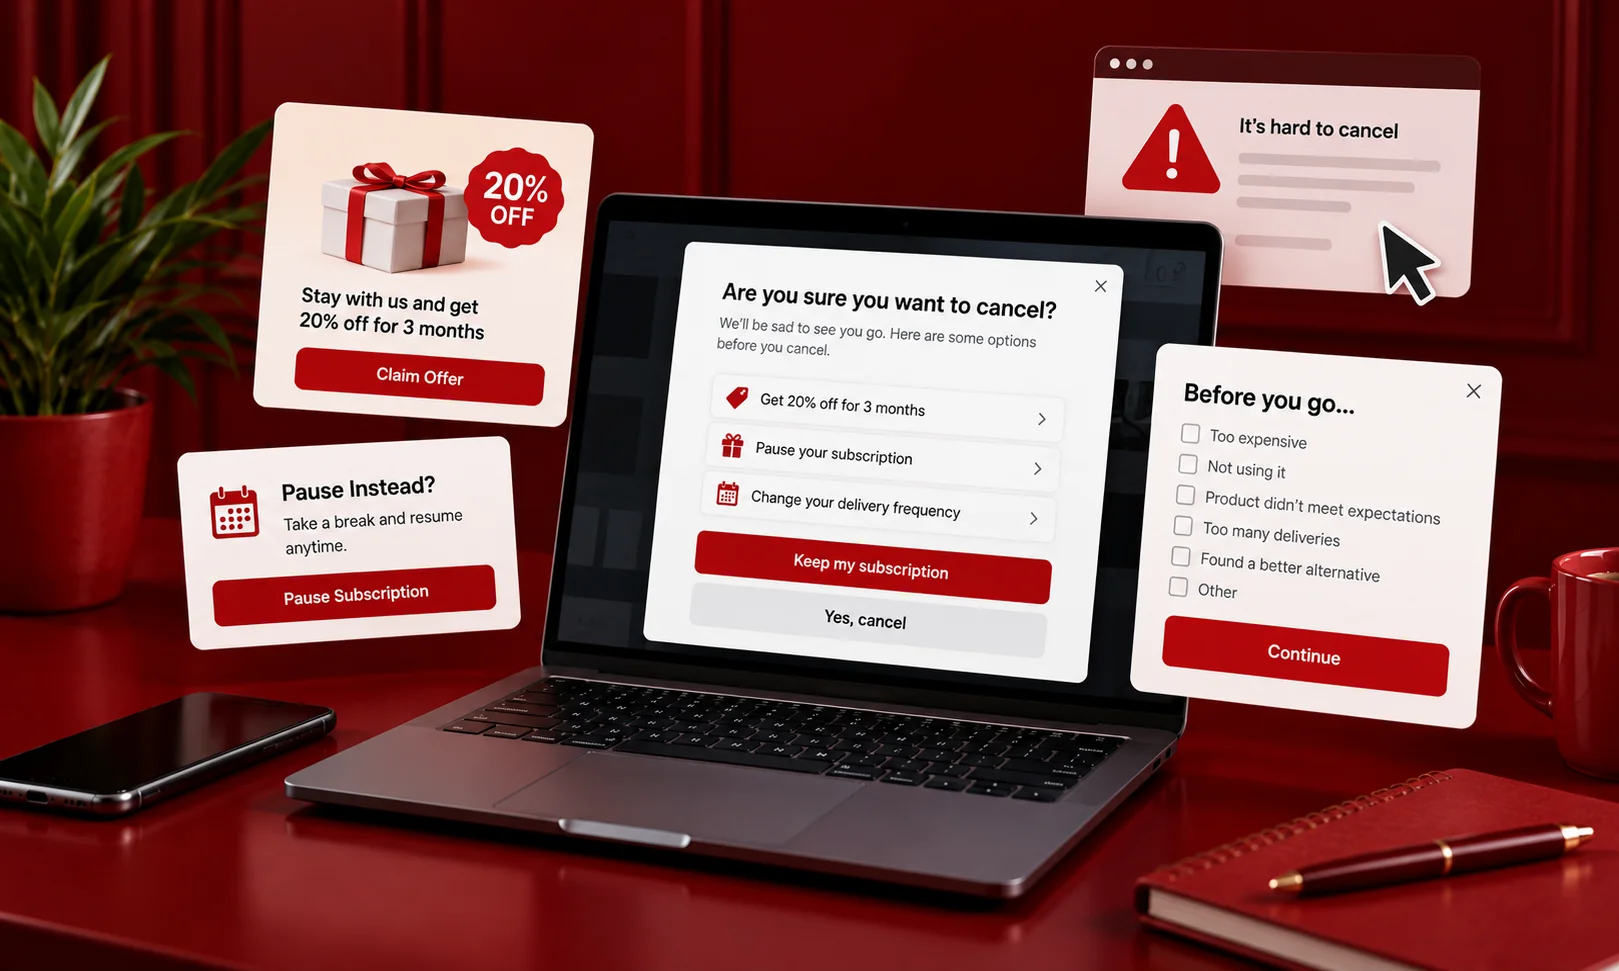
Some retention tactics improve the dashboard without improving the relationship.
Aggressive save offers are the obvious example. If a customer says the product is unused and the business responds with 20% off, the discount may delay the cancellation without fixing the underlying problem. It can also train customers to threaten cancellation whenever they want a lower price.
Cancellation friction has a different problem. Hiding the cancel path, forcing unnecessary calls, or repeatedly interrupting the process may reduce recorded cancellations while increasing frustration and complaints.
In the U.S., the Federal Trade Commission’s 2024 “click-to-cancel” rule was designed to require cancellation to be as easy as enrollment for covered negative-option programs; its applicability and current status should be checked before implementation because the rule has faced legal proceedings.
The third trap is permanent discounting. A temporary incentive can make sense for a specific, recoverable objection. A permanent price reset can damage willingness to pay and make the original price harder to defend.
The test is simple: did the intervention change behavior after the incentive ended? If not, the business may have purchased time rather than retention.
What Good Looks Like
There is no single good subscription churn rate. Category, billing cadence, acquisition model, ARPC, cohort definition, and measurement method can materially change the answer.
For context, Recurly’s July 2026 network data reports median annual churn of 4.25% for ecommerce, versus 3.22% for SaaS, with ecommerce involuntary churn at 1.38%. Use these figures as context rather than targets: they come from Recurly’s network, and Recurly sells subscription and billing software.
Cohort shape is more useful for operating decisions. A September 2026 DTC Pages analysis measured 8 subscription programs across 438,961 subscribers. It found 51% of cohorts in four consumable categories were still active at month 3, while the one non-consumable category measured was at 14%. The sample is small and based on programs to which the publisher had dashboard access, so it is not a universal benchmark.
What matters is the curve. A steep early drop followed by a flat tail suggests an activation or expectation problem. A curve that keeps falling points to a less durable customer relationship.
So, what is a good churn rate? The useful answer is: one that is improving within a comparable cohort without being purchased through unsustainable discounts or distorted cancellation practices.
The Read
The biggest churn mistake is treating the cancellation event as the beginning of the problem.
It is usually the end of a chain: an expectation was missed, value was not experienced, delivery disappointed, usage faded, a plan stopped fitting, or a payment failed. The cancellation page can recover some of these customers, but it cannot repair every upstream failure.
For subscription churn reduction, the practical move this week is to build one chart: a cohort retention curve from signup through at least 6 renewal cycles, split by voluntary and involuntary churn. Mark the first major drop and annotate what happened there.
That chart tells you where the retention budget should go. The cancellation flow may still deserve work. It just should not automatically get the most.