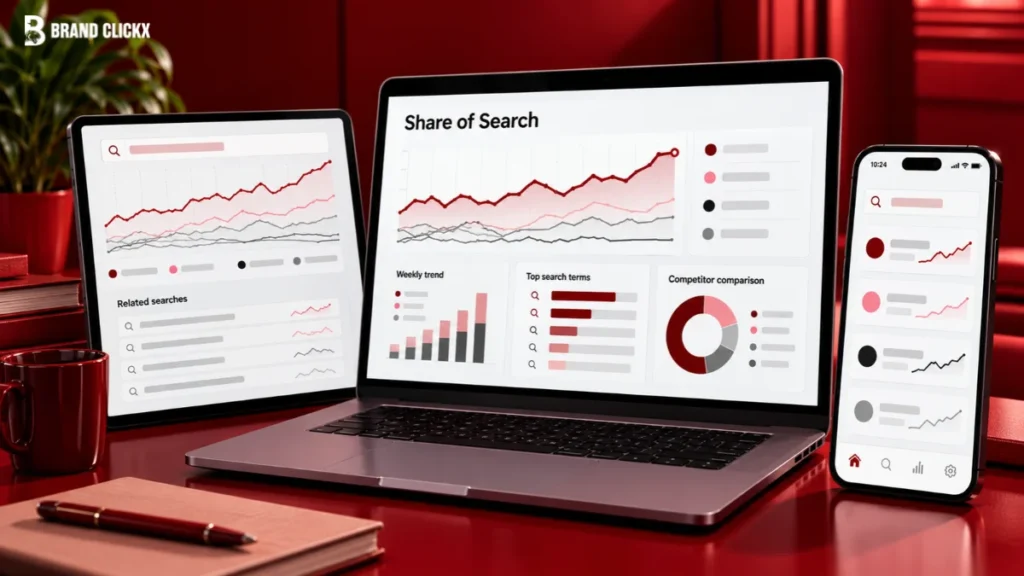

A brand metric that costs nothing, updates every week, and can show changes before sales data arrives sounds almost too useful. That is the appeal of share of search. The catch is that the number is only as good as the category, competitor set, search terms, and time series behind it.
A share of search metric measures a brand’s share of branded search activity against a defined set of competitors. It is not a magic market-share forecast, and it is not a substitute for brand research. Used carefully, though, it gives marketers a cheap behavioral signal of demand.
The argument is simple: share of search is the cheapest useful brand metric available, but only when it is built as a consistent series rather than treated as a single number.
Key Takeaways
- Share of search measures branded search demand relative to a defined competitive set.
- The strongest published evidence links it with market share, but the lead time varies by category.
- You can build a basic series for free with Google Trends.
- Four common errors can make the metric misleading: polluted brand terms, the wrong competitors, navigational searches, and unexplained spikes.
- Treat share of search as a trend and diagnostic signal, not as proof that sales will move by a fixed amount.
What It Actually Measures
Share of search is the proportion of branded searches going to one brand compared with the total branded searches across a defined competitor set.
The basic calculation is:
Share of search = Brand searches ÷ Total searches for the selected brands × 100
For example, suppose five competing brands generate 1 million relevant branded searches over a year, and Brand A accounts for 180,000. Its share of search is 18%.
That makes it a demand measurement signal, not an awareness measure.
Awareness asks whether people know a brand exists. Share of search asks whether people are actively typing that brand into a search engine. Someone can recognize a brand without searching for it, while someone searching for a brand has taken a more active step.
That distinction matters. Search behavior is closer to expressed interest than a survey response, but it still does not tell you why the person searched or whether they eventually bought.
Google Trends provides a free way to work with this type of data. Google says Trends uses an aggregated, anonymized sample of searches and normalizes results rather than providing absolute search counts.
So the useful question is not, “How many searches did we get?” It is, “How is our share of branded search changing against the same competitors over time?”
What the Evidence Says About the Lead Relationship

The evidence for share of search is real, but the popular version is often too broad.
The original work presented by Les Binet at the IPA EffWorks Global 2020 conference presentation found a relationship between share of search and market share across automotive, energy, and mobile handset categories. The automotive analysis covered 23 brands and 920 quarterly observations from 2004 to 2015. The reported lead time differed substantially by category: changes in share of search preceded market-share changes by up to 12 months for cars, six months for mobile phones, and three months for energy.
That is very different from saying that share of search always predicts market share 6–12 months ahead.
The lead depends partly on how consumers buy the category. Cars involve long consideration and purchase cycles, so there is more time for search behavior to appear before a purchase. A shorter-cycle category can behave differently.
The later IPA Share of Search Think Tank research, presented by James Hankins in 2021 as cross-industry effectiveness research, expanded the evidence to 30 case studies across 12 categories, seven countries, and multiple languages. It found that share of search appeared to represent 83% of share of market on average. But the IPA explicitly says these are correlations, not causal relationships, and that the ratio varies by category and country.
That makes share of search useful for marketing effectiveness, but not as a standalone forecasting model. The honest claim is that it can act as an early indicator of market-share movement in some categories. It is not a universal rule that converts search share into future sales.
Building One, Step by Step
You do not need an expensive measurement platform to start. A basic share of search series can be built this week using Google Trends and a spreadsheet.
1. Define the category
Start with the market you actually want to measure.
Do not make the category so broad that unrelated brands enter the denominator. If you are measuring premium running shoes, for example, define the market before choosing the brands.
Write the definition down. Do not change it every month.
2. Define the competitor set
Choose the brands consumers genuinely compare within that category.
Your set should reflect the market, not the brands your marketing team happens to watch. Include the major relevant brands and document why each one is included.
3. Pull branded search data
Google Trends is the free option. Google says its Explore tool lets users compare search terms and topics over time and by geography. Current Google Trends functionality allows multiple terms to be compared, while the exact comparison limits depend on the version of Explore being used.
For each brand, decide which branded terms belong in the measurement. Include obvious spelling variants where appropriate, but keep the rules consistent.
4. Calculate the share
For each period:
Brand A search interest ÷ total search interest for the competitor set = Brand A share of search
Because Google Trends data is indexed rather than reported as absolute search volume, the calculation requires consistent comparison settings. Trends normalizes results to a 0–100 scale for the selected time and location.
5. Plot the series
Do not stop at this month’s percentage.
Build a monthly or quarterly series and keep adding observations. The IPA’s 2021 research recommended using a 6–12 month rolling average to smooth noise.
For practical brand health tracking, a rolling series is much more useful than a dashboard showing one isolated percentage.
Screenshot-worthy build checklist
| Step | Decision to lock down |
| Category | What exact market are we measuring? |
| Geography | Which country or market? |
| Competitors | Which brands belong in the denominator? |
| Search terms | Which brand names and variants count? |
| Time period | Monthly or quarterly? |
| Smoothing | 6-, 9-, or 12-month rolling average? |
| Interpretation | What counts as a meaningful movement? |
A short series tells you very little. Three weeks of data can show that something happened; it cannot tell you whether your brand’s underlying demand position is changing. Start with several years if the data is available, then maintain the same methodology going forward.
The 4 Things That Make It Meaningless

The calculation is simple. Building a trustworthy number is not.
1. The brand name is also a common word
Some brand names overlap with ordinary language, places, people, or other entities. Search volume for those terms can contain activity that has nothing to do with the brand.
Fix: use the most precise available search term or topic, test the term against related searches, and document exclusions. If the brand cannot be separated from unrelated demand, treat the result as unreliable.
2. The competitor set is based on opinion
A CMO may think Brand A competes with Brand B because both appear in the same strategic presentation. Consumers may have a completely different comparison set.
Fix: define the competitive market using customer behavior, category knowledge, sales data, retailer structure, or research. Then keep the set stable.
A competitor entering the denominator can change everyone’s share even when nobody’s underlying search demand changes.
3. Existing customers are mistaken for new demand
A branded search can be highly navigational. Someone searching for a bank, retailer, airline, or software brand may already be a customer and simply be trying to log in, find a store, check an order, or access support.
Fix: where possible, separate clearly navigational terms from genuine product or purchase-related branded searches. At minimum, recognize that total branded search contains both existing-customer activity and prospective demand.
This is one reason share of search should not be presented as pure acquisition intent.
4. Spikes are treated as trends
A celebrity mention, product recall, scandal, viral campaign, sports event, acquisition, or news story can send branded searches sharply higher.
That does not necessarily mean the brand has built durable demand.
Fix: annotate major events directly on the chart and use rolling averages. Ask whether the increase survives after the event disappears.
The goal is not to remove every spike. Spikes can be strategically important. The mistake is treating every spike as evidence of long-term brand growth.
What to Do With the Number Once You Have It
Start with the trend, not the absolute level.
An 18% share of search is not inherently good, bad, or predictive. Its meaning depends on the category, competitive structure, historical relationship with market share, and direction of travel.
Your own series is also more useful than somebody else’s benchmark. If your share moves from 14% to 18% under a consistent methodology, that is a meaningful internal signal even if another category operates at completely different levels.
Next, compare the series with marketing investment. The IPA’s 2021 cross-industry research, published as industry effectiveness research, found a relationship between share of voice, spend, and share of search: brands spending above their market share and increasing share of voice tended to increase share of search.
That gives the metric a practical role. If spend increases and share of search rises, you have a useful signal. If spend rises while share of search falls, investigate rather than automatically declaring the campaign successful.
This is where brand tracking becomes more useful: place share of search beside other measures rather than asking it to carry the whole story.
For an executive scorecard, keep the reporting simple. Our CMO scorecard framework makes the broader point that executive metrics should stay focused, while detailed diagnostics belong in operational reporting.
Share of search is best treated as a leading diagnostic that connects brand activity to future demand, while sales and market share remain the commercial outcomes.
What It Does Not Tell You
Share of search does not tell you how people feel about a brand.
A rise can come from admiration, curiosity, controversy, confusion, a product problem, or a campaign people cannot stop talking about. Search behavior tells you that attention or demand exists. It does not tell you whether that attention is positive.
It is also blind to some of the things that matter most in positioning. Two brands can have similar search shares while being strongly associated with completely different benefits, audiences, or buying situations.
That is where category entry points matter. If consumers rarely search by brand because they enter the category through generic needs, occasions, recommendations, or physical retail, branded search will capture only part of the demand system.
Some categories are particularly poor fits. Share of search can be weak or effectively useless where:
- the purchase is almost entirely offline and rarely researched through search;
- the category has extremely low search volume;
- brand names are heavily contaminated by common-language meanings;
- purchases are driven mainly by institutional procurement or contracts;
- consumers buy through intermediaries without searching individual brands;
- the competitor set cannot be defined consistently.
The metric is also less useful when a brand has very little search volume and the data is dominated by noise.
That does not make the metric bad. It means the measurement question does not match the behavior of the category.
Share of search should therefore sit alongside, not replace, surveys, sales data, customer research, and other brand-health evidence. It is particularly valuable because it captures behavior cheaply, but cheap does not mean complete.
The Read
Share of search belongs on a CMO’s dashboard, but I would be cautious about calling it a board-level outcome metric on its own.
Its real strength is diagnostic. It gives marketers a fast, inexpensive view of whether branded demand is gaining or losing ground against competitors, and the published evidence shows that the relationship with market share can be useful. But the evidence is category-specific, correlational, and more nuanced than the familiar “six to 12 months ahead” headline suggests.
The best use is simple: build the series, keep the methodology boring, annotate the noise, and watch the direction.
If you want one practical task this week, open Google Trends, define five real competitors, pull several years of comparable data, and calculate the monthly share for each. Do that consistently for the next year, and you will have something far more valuable than a one-off brand metric: a usable record of how demand for your brand is moving.