
Two ecommerce brands can look very different on paper.
One says email and SMS bring in 34% of revenue. Another says the same channels bring in 19%.
At first glance, the 34% looks better. More revenue from owned channels must mean the retention engine is working, right?
Not necessarily.
The problem with email sms revenue share is that the number usually tells you what the attribution system credited to email or SMS, not what those messages actually caused. A customer may already be ready to buy, open an email on the way, click it, and place the order. The platform can then give email the credit.
Change the attribution window or model, and that same order may belong somewhere else.
That is the part most benchmark reports miss. So before putting your owned-channel percentage into a board deck, it is worth asking a simpler question: how much of this revenue would we have got anyway?
Key Takeaways
- A high owned-channel share does not automatically mean a strong retention program.
- Published benchmarks vary because publishers use different datasets and attribution rules.
- A falling acquisition denominator can make your owned-channel share rise even when the channel itself has not improved.
- A holdout test gives you a much better estimate of incremental email revenue.
- Report incremental revenue and contribution margin alongside attributed revenue.
What does the number actually measure?
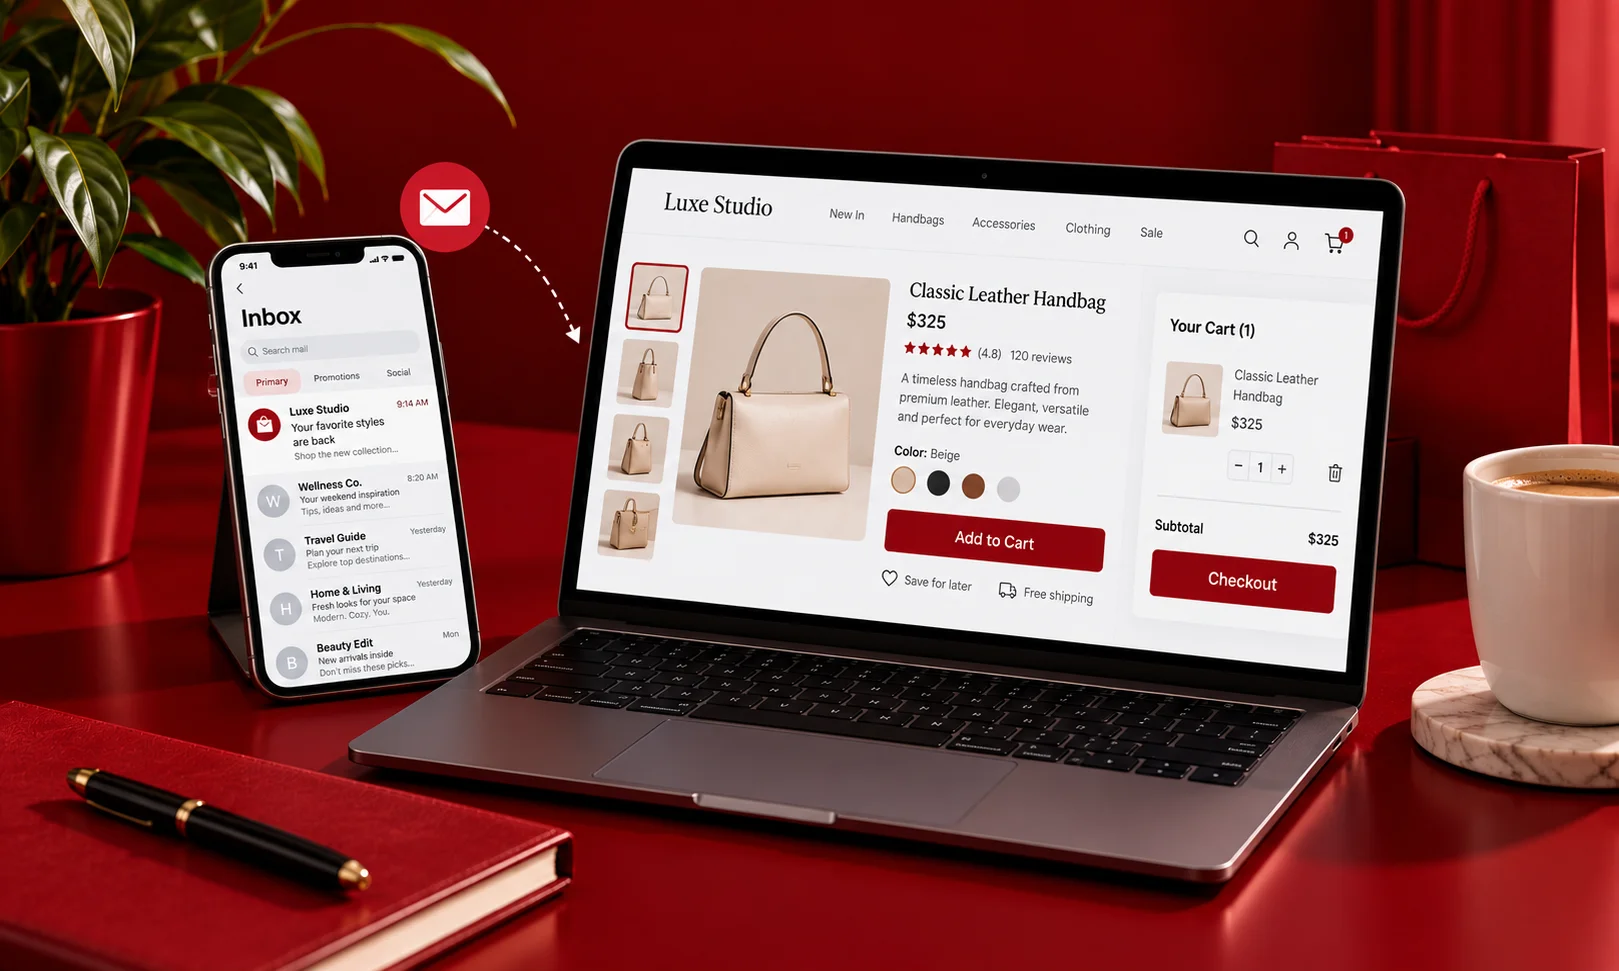
Before asking “What is a good email revenue share?”, ask what your percentage is actually measuring.
There is a big difference between attributed revenue and incremental revenue.
Attributed revenue is the revenue your platform assigns to a channel after someone interacts with it. Incremental revenue is the revenue that would not have happened without that interaction.
Those two numbers can be very different.
Take a customer who has already visited your site three times and added a product to their cart. The next morning, they receive an email, click it and buy.
Klaviyo can attribute that purchase to email depending on the attribution settings being used. Its default model for new accounts uses last-touch attribution, with 5-day windows for email clicks and opens, 5 days for SMS clicks, and 1 day for SMS opens.
But did the email create the purchase?
Maybe. Maybe it simply happened to be the last thing the customer clicked.
This is also why owned channel revenue can become confusing when different platforms are involved. Your ecommerce platform, ad platform and ESP can all claim the same order under different rules.
So “email generated 28% of revenue” is not enough information for a board report.
A more useful statement would be:
“Email received credit for 28% of store revenue under Klaviyo’s last-touch model using a 5-day attribution window.”
Now everyone knows what the number actually means.
What are the benchmarks and how useful are they?
There are plenty of email revenue benchmarks floating around.
The problem is that they are not measuring exactly the same thing.
Klaviyo’s ecommerce benchmark analysis found that email accounted for 27% of store revenue on average in its analyzed Q4 dataset. That is a useful reference point, but it is an attributed-revenue benchmark, not proof that email caused 27% of purchases.
Other datasets show different numbers.
Excelohunt’s 2026 UK ecommerce benchmark reports email revenue shares of 18–25% for fashion and apparel, 20–28% for beauty and skincare, 22–30% for health and supplements, 15–22% for home and living, and 14–20% for food and beverage. Excelohunt describes these as email-attributed revenue as a percentage of total revenue, but does not publish one standardized attribution window across the categories.
Top Growth Marketing reports 22% for apparel and fashion, 28% for beauty and skincare, 30% for health and supplements, 20% for food and beverage, and 25% for home and garden across its DTC portfolio. Its dataset covers more than 200 DTC accounts using Klaviyo alongside SMS platforms, but it does not specify a standardized attribution window for these figures.
| Category | Published figure | Publisher | Attribution basis |
| Ecommerce overall | 27% | Klaviyo | Email-attributed purchases; Q4 benchmark |
| Fashion & apparel | 18–25% | Excelohunt | Email-attributed revenue / total revenue; window not stated |
| Beauty & skincare | 20–28% | Excelohunt | Email-attributed revenue / total revenue; window not stated |
| Health & supplements | 22–30% | Excelohunt | Email-attributed revenue / total revenue; window not stated |
| Home & living | 15–22% | Excelohunt | Email-attributed revenue / total revenue; window not stated |
| Food & beverage | 14–20% | Excelohunt | Email-attributed revenue / total revenue; window not stated |
| Apparel & fashion | 22% | Top Growth Marketing | DTC portfolio; window not stated |
| Beauty & skincare | 28% | Top Growth Marketing | DTC portfolio; window not stated |
| Health & supplements | 30% | Top Growth Marketing | DTC portfolio; window not stated |
So what is a good email revenue share?
There isn’t one number you can safely use across every store.
The klaviyo benchmarks and other published figures are useful for spotting unusual performance. They are much less useful as targets.
If your brand reports 12% and another reports 30%, that does not automatically mean the second brand has a better retention engine. Their customers, acquisition mix, product category, list size, discount strategy and attribution rules could all be different.
Use the benchmark as a question starter, not as a score.
Why can a high share actually be bad news?
This is where the metric gets interesting.
A high owned-channel share can happen because email and SMS are genuinely working.
But it can also happen because the rest of the business is shrinking.
Say your store makes $1 million a month.
Email and SMS receive credit for $200,000.
Your owned-channel share is:
$200K ÷ $1M = 20%
Now imagine acquisition slows down.
Total revenue falls to $600,000, but email and SMS still receive credit for roughly $200,000.
Suddenly:
$200K ÷ $600K = 33.3%
Your owned-channel share jumped from 20% to 33.3%.
Did email suddenly become 66% better?
No.
The denominator got smaller.
This is one of the easiest ways to misread the metric. A brand with weakening acquisition can look increasingly “retention-led” simply because less revenue is coming from elsewhere.
There is another problem: discounts.
Suppose a customer was already planning to buy a $100 product. Your email gives them 20% off. They click, buy for $80, and the platform records an email-attributed sale.
The dashboard looks great.
But the business may have traded $20 of margin for an order that was going to happen anyway.
The same thing can happen with paid acquisition. Someone sees a Meta ad, visits the site, leaves, comes back later through an email and buys.
Email gets the last touch.
But the email did not necessarily create the demand.
This is why a high share should make you ask “why?”, rather than immediately assuming “great.”
What is the channel actually adding?
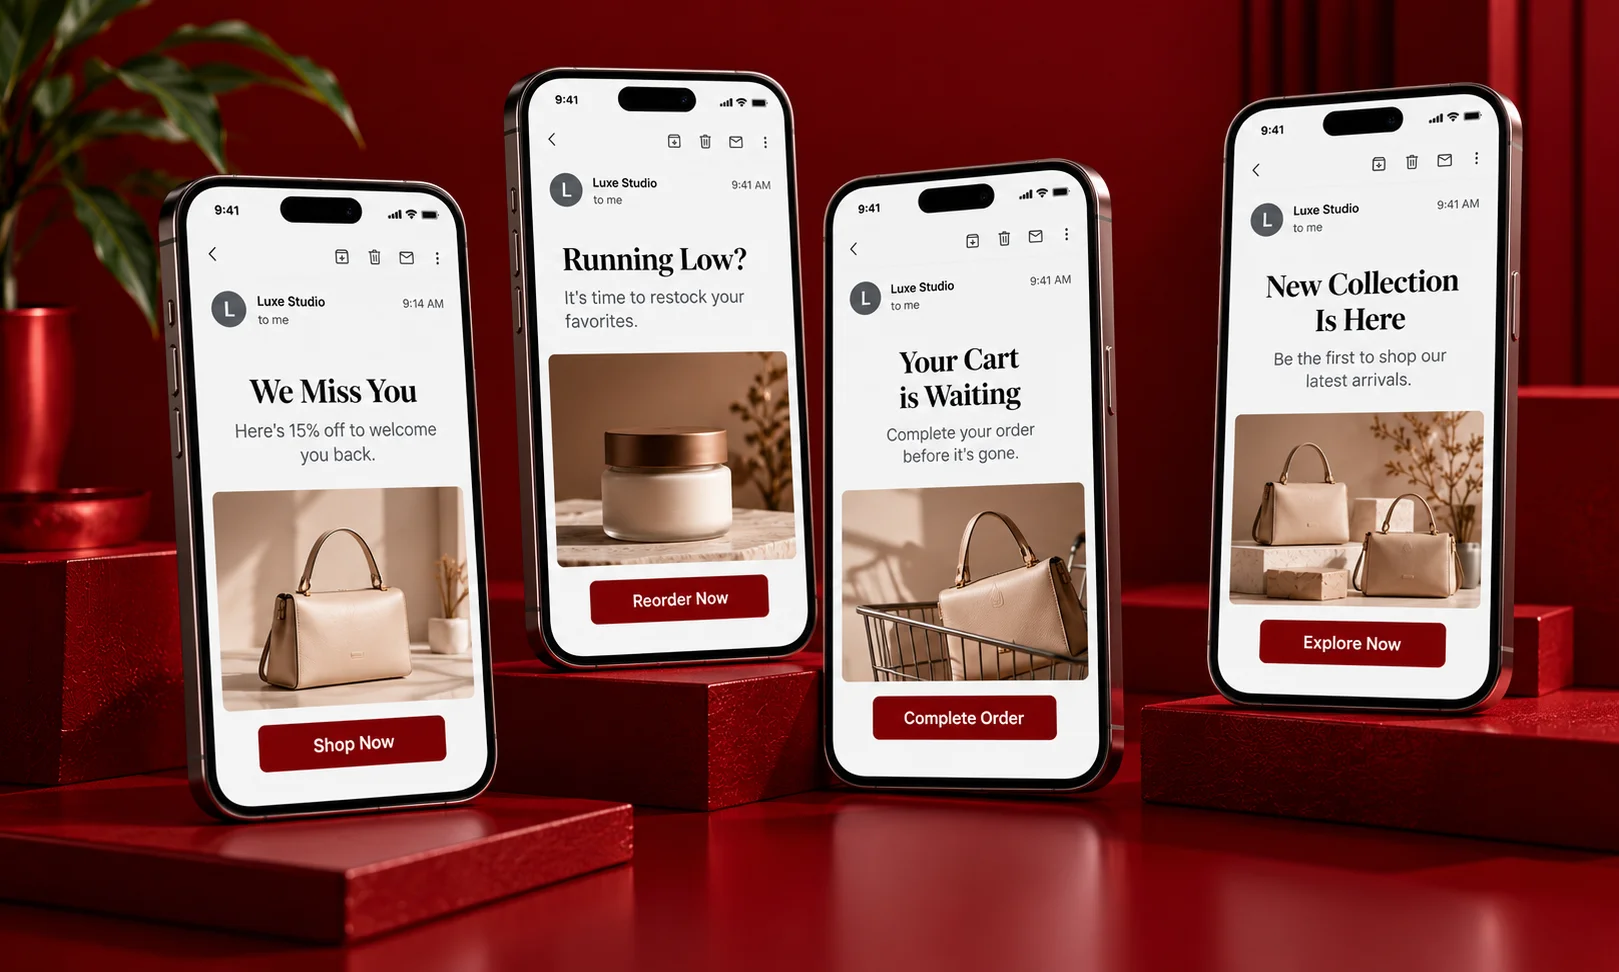
Email and SMS can absolutely create incremental revenue.
The trick is figuring out where they are most likely to do it.
Reactivation is one obvious example. Someone who has not purchased for months may need a timely reason to come back.
Replenishment is another. If a customer typically runs out of a product after 45 days, a useful reminder around day 40 can change when they buy.
Abandoned-purchase messages can also work because they target people who have already shown buying intent.
And then there are product launches. A new product sent to an existing customer base can generate purchases that would not necessarily have happened without the announcement.
Research backs up the broader idea that triggered email can create incremental sales. A randomized study of browse-abandonment emails found that customers receiving the messages generated higher online revenue than the control group that did not receive them.
But that does not mean every abandoned-cart or browse email is incremental.
That is the important distinction.
Look at your retention cohorts too. If customers receiving a message purchase again sooner, maintain a healthy average order value, and outperform a comparable control group, you have stronger evidence that the channel is changing behavior.
That matters more than simply seeing a large percentage in your dashboard.
How do you run a holdout on email?
If you want to know what email actually adds, run a holdout.
The idea is surprisingly simple: take customers who would normally receive the message and randomly keep some of them out.
The simple email holdout
- Choose your audience.
Start with customers who would normally qualify for the campaign or flow. - Split them randomly.
The treatment group gets the email. The control group does not. - Balance the groups.
Match them as closely as possible on previous purchases, order frequency, recent activity, customer age and other important behaviors. - Keep everything else the same.
Do not change prices, products, paid media or the website experience during the test. - Measure revenue per eligible recipient.
Do not measure only opens, clicks or revenue from people who engaged. - Compare treatment with control.
If the treatment group generates $5.20 per recipient and the control generates $4.70, the measured incremental revenue is $0.50 per recipient. - Repeat the test.
One test gives you evidence. Repeated tests give you something you can actually use for planning.
The key is to give the test enough time to capture the normal purchase cycle.
A fast-moving ecommerce brand may learn something useful over a few weeks. A brand with a longer buying cycle needs more time.
Operators such as Kevin Hillstrom have used email mail/holdout testing to separate demand associated with email from demand that exists without it.
And yes, there is an obvious objection:
“But we’re losing sales by withholding the email.”
That’s true.
You are deliberately giving up some potentially attributable revenue so you can find out how much revenue the email actually creates.
Without that control group, you may spend years optimizing a number that looks impressive but tells you very little about causality.
What should you report instead of revenue share?
You don’t have to delete revenue share from the dashboard.
Just stop making it the headline.
Start with incremental revenue per recipient:
(Treatment revenue − control revenue) ÷ treatment recipients
That gives you a much more useful answer than “email generated 27% of revenue.”
Then look at revenue per active subscriber per month. Is each subscriber becoming more valuable, or are you simply adding more people to the list?
List health matters too. A huge database with declining engagement is not necessarily a healthy owned channel.
And revenue should eventually meet margin.
A campaign that generates $100,000 while giving away $25,000 in discounts is not economically equivalent to one that generates $100,000 without the same discount burden.
That is where contribution margin becomes important.
You can also connect this to customer lifetime value. If an email creates a genuinely incremental second or third purchase, its value may extend well beyond the revenue from that single campaign.
So your board-level dashboard could look more like this:
| Metric | What it tells you |
| Attributed revenue share | What the platform credited |
| Incremental revenue per recipient | What the message actually added |
| Revenue per active subscriber | How productive the audience is |
| Contribution margin | Whether the revenue created economic value |
| Repeat-purchase rate | Whether customer behavior changed |
| List health | Whether the audience remains engaged |
That’s a much more useful conversation than arguing over whether 20% or 30% is the “right” benchmark.
Should email and SMS be reported together?
I’d keep them separate.
Email and SMS may both sit under “owned channels,” but they behave differently.
The cost structure is different. SMS has a direct per-message cost that email generally does not have in the same way.
The consent rules are also different. In the UK, for example, the ICO says marketing consent needs to be specific to the type of electronic communication, meaning consent for email does not automatically cover text messages.
Then there is frequency.
Most customers will tolerate a very different number of email messages compared with text messages. SMS is more immediate and more intrusive, which makes timing and frequency especially important.
Even Klaviyo’s default attribution settings treat the channels differently: its current defaults give email clicks and opens a 5-day window, SMS clicks 5 days, and SMS opens 1 day.
So if your dashboard says:
Email + SMS = 35% of revenue
you still don’t know much.
Was it 28% email and 7% SMS?
15% and 20%?
Which one had the better incremental lift?
Which one produced more margin?
Those are much more useful questions.
Keep separate metrics for email and SMS, then combine them only when you need a high-level owned-channel view.
The read
I wouldn’t completely throw away the owned-channel-share metric.
It’s useful context.
It can tell you how dependent the business is on owned channels and help you spot major changes over time.
But I would stop treating it as a measure of channel effectiveness.
A 30% share does not mean email and SMS caused 30% of your revenue. It means your attribution setup gave those channels credit for 30%.
Starting this month, report incremental revenue per eligible recipient from a randomized holdout alongside the share.
That is the number that gets you closer to the real question:
If we stopped sending, how much revenue would actually disappear?