Before approving a production run, calculate margin from a fully loaded per-unit cost and test it against the likely selling price in each channel. The method helps apparel brands make better production, pricing, and business decisions before cash is tied up in inventory.
A factory quote alone cannot show whether a style will earn enough. You also need to account for materials, labor, delivery, and the costs of selling the garment. Landed cost is the per-unit cost of getting a product made, shipped, cleared through customs, and ready for sale.
Start with a cost sheet, use it to test possible prices, then check whether demand and production risk make the order sensible. You can use the same process for a new clothing line or one new product in an established brand. Treat every unconfirmed quote or cost allowance as a risk to resolve before you commit to a bulk order.
Key Takeaways
- Build a full cost sheet before setting the selling price.
- Keep unit cost and landed cost as separate figures.
- Use gross margin, not markup, to test a price target.
- Model each sales channel and its costs on its own.
- Compare the required price with customer demand and available cash.
What Should Go on a Preproduction Cost Sheet?

A cost sheet is only as reliable as the quantities and inclusions behind each line item. Use it to estimate the cost of one sellable garment, not just the factory’s headline quote. Each input should have a clear amount, unit, and status.
Record every cost that changes the unit cost, from fabric through packaging and testing. Keep separate lines for fabric, trims, labor, overhead, finishing, packaging, freight, and testing. You can then see which estimate drives a price change instead of hiding several costs inside one total.
Track material use and cutting waste
Start with the fabric needed for one finished garment, then add an allowance for cutting waste. A T-shirt that uses 1 yard in the pattern can be costed at 1.05 yards. That adds 5% to the material quantity, not to every other cost.
Garment costing often allows 5-10% for cutting scrap, errors, and pattern matching. The right amount depends on the pattern and fabric, so do not treat one allowance as a rule for every style. A print that must match at seams can use more fabric than a simple solid knit.
Cost the fabric that production will consume, not only the fabric visible in the finished garment.
Keep the material quantity visible beside its unit price. If fabric costs $8 per yard and the sheet uses 1.05 yards, the fabric line is $8.40 per garment. This makes a yield change easy to spot when the pattern or size mix changes.
Separate quoted amounts from cost allowances
Mark each amount as confirmed or estimated. A quote is confirmed only when its scope and terms are clear; an allowance is your planning estimate for a cost that still needs a firm number.
For each quote, record these fields before comparing suppliers:
- Currency, such as U.S. dollars or another stated currency.
- Quantity basis, such as one garment, one color, or one order.
- Included work and materials, such as sewing, finishing, and packing.
- Status, marked as confirmed or estimated.
Ask whether the amount includes the finish and packaging you expect. A low number may cover sewing but exclude labels, pressing, or individual bags. Recheck fabric consumption against the final pattern marker before treating the material total as firm.
How to Calculate Fashion Product Margins Before Production Step by Step
If a garment costs $20 and sells for $40, the $20 profit is half the selling price, so gross margin is 50%. Gross margin measures profit against revenue, which makes it useful when you compare selling prices. Use the selling price as the base.
Gross margin = (selling price − cost of goods sold) ÷ selling price × 100. For a planned target, set the selling price to landed cost ÷ (1 − target gross margin). Use the same cost basis throughout your test.
Calculate gross margin from the selling price
Suppose your landed cost is $30 and the planned selling price is $70. The $40 difference divided by $70 gives a 57.1% gross margin. A gross profit margin formula uses revenue as the denominator, not cost.
The table shows how cost-based markup differs from revenue-based gross margin. Each example uses the stated cost as its base, then compares the profit with cost and selling price.
| Example | Cost | Selling price | Markup | Gross margin |
|---|---|---|---|---|
| Garment A | $50 | $100 | 100% | 50% |
| Garment B | $20 | $40 | 100% | 50% |
| Garment C | $30 | $70 | 133.3% | 57.1% |
Translate markup into the margin you actually want
Markup is profit divided by cost. Margin is profit divided by selling price. The two percentages use different bases, so they do not mean the same thing.
A 100% markup doubles a $50 cost to a $100 selling price. The $50 profit is half of that price, creating a 50% gross margin. In the same way, a $20 garment wholesaled for $40 has a 50% manufacturing sales margin.
Do not treat a 50% markup as a 50% margin. A 50% markup on a $20 cost adds $10, making the price $30. The $10 profit is only one-third of the selling price. Before approving any price, verify that the percentage you calculated is based on selling price rather than cost.
How Do You Turn a Factory Quote Into Landed Cost?
A factory quote becomes a useful pricing input only after you add the expenses required to get the garment ready for sale. Landed cost includes the product, freight, duties and taxes, insurance, and handling. The factory price is only one layer.
Keep factory cost and landed cost separate when you test gross margin. Start with the garment’s factory price, then add freight and insurance. Add any import duty and tax, customs handling, and delivery from the port or airport to your warehouse.
For example, a garment with a $30 factory price has $3 in freight and insurance. A 15% duty on the $30 factory price adds $4.50, creating a $37.50 subtotal before inland handling. The final landed cost rises when you add that delivery and any other outstanding charges.
Customs duty on apparel generally uses the customs value multiplied by the applicable ad valorem rate. “Ad valorem” means the charge is calculated as a percentage of value. Freight and insurance can also affect the customs value under the rules for the shipment.
A quote label does not prove which delivery, customs, or compliance costs it covers. Ask for the included services and terms in writing, then list every excluded cost in your own sheet. You may need separate allowances for brokerage, warehouse delivery, or inspection.
Compare two factory offers only after both use the same scope and quantity basis. A lower quote can look attractive while shifting logistics work or charges to your brand. Keep factory cost and landed cost as separate columns so a lower factory quote cannot disguise higher delivery expenses.
Which U.S. Apparel Tariffs Belong in the Cost Model?
U.S. apparel tariffs depend on the garment’s construction, fiber, category, and country of origin. Two shirts can face different duties for those reasons. Classify the garment before using a rate in your cost model.
As of July 2026, apparel MFN base duties commonly range from 10% to 32%. The applicable rate depends on the garment’s HTS classification. The 2026 U.S. Harmonized Tariff Schedule, Revision 22, lists tariff rates and statistical categories.
Confirm the garment’s HTS classification
HTS Chapter 61 covers knitted or crocheted apparel, while Chapter 62 covers woven apparel. Classification also depends on the garment type, gender category, and chief-weight fiber. The U.S. Harmonized Tariff Schedule gives the official categories and rates.
As of July 2026, a men’s cotton knit T-shirt under HTS 6109.10.00 has a 16.5% MFN duty rate. A men’s cotton woven shirt under HTS 6205.20.20 has a 19.7% MFN duty rate. These examples show why one generic apparel rate can misstate your cost.
| Garment or qualification | HTS code or condition | Applicable tariff treatment | Key note |
|---|---|---|---|
| Men’s cotton knit T-shirt | 6109.10.00 | 16.5% 2026 MFN duty | Knitted construction |
| Men’s cotton woven shirt | 6205.20.20 | 19.7% 2026 MFN duty | Woven construction |
| Covered China-origin apparel line | Covered product from China | 7.5% Section 301 duty may apply | Check the line’s coverage |
| Qualifying USMCA apparel | Meets agreement requirements | Duty-free | Eligibility rules must be met |
Add applicable duties and import fees
As of July 2026, a 10% Section 122 surcharge applied to apparel imports, in addition to the applicable MFN base duty. Covered China-origin apparel lines could also face a 7.5% Section 301 duty. A garment’s classification does not make every added tariff apply to every origin.
Before production, check these five details:
- Whether the garment is knit or woven.
- The chief-weight fiber.
- The garment type.
- The gender category.
- The country of origin and USMCA eligibility.
Import fees have their own rules. In 2026, the Merchandise Processing Fee was 0.3464%, with a $26.22 minimum and $508.70 maximum. The Harbor Maintenance Fee was 0.125% ad valorem on ocean freight imports.
Before additional tariff changes described for 2025 and 2026, the applied U.S. apparel tariff rate sat around 14%-15% in recent years. Do not use that history as a universal rate or apply one example to every garment. Confirm the tariff classification and applicable rates for the actual garment and origin before locking the landed-cost sheet.
How Do Production Method and Labor Change Unit Cost?

A production quote is easier to compare when you know whether it covers a complete garment or only selected manufacturing steps. Full-package production (FPP) and cut, make, trim (CMT) assign sourcing and factory work differently. Scope affects price.
FPP covers more of the product process, while CMT mainly covers cut-and-sew work. In FPP, the factory sources materials and manages the garment through finishing and packing. In CMT, your brand coordinates the materials and pays the factory for cutting and sewing.
Compare FPP with CMT
FPP can make the quote easier to read because one factory manages more steps. That does not mean every FPP quote includes the same finishes or packing. Check the specific inclusions for each offer.
CMT can give you more control over material sourcing. You may choose fabric and trims directly, then send them to the factory. In return, you must track more separate inputs and coordinate their arrival for production.
Estimate sewing time by garment complexity
A Standard Minute Value, or SMV, estimates the time needed to produce a garment. A basic T-shirt might have an 8-minute SMV. A complex jacket may need 60 minutes or more because it has more parts and operations.
That difference helps explain why labor quotes vary across products. A jacket with several panels, pockets, and closures can take far longer to sew than a plain tee. The SMV is an estimate, not a promise that each operator or factory will work at the same pace.
Ask the factory to state which production operations and materials are inside the quoted unit price. A clear scope lets you compare the factory’s work with the materials and services your brand must arrange separately.
How Should You Price for Wholesale and Direct Sales?
A style intended for both DTC and wholesale needs a price ladder that leaves workable economics for each seller. DTC means direct-to-consumer sales, where your brand sells straight to shoppers. One price may not fit both.
Use channel multipliers as rough planning practices, not required formulas. Apparel brands often start wholesale at 2.0-2.5 times landed cost. Retailers often use 2.2-2.5 times the wholesale price, while a DTC example may use 3-5 times landed cost.
Build the wholesale and retail price ladder
The ranges below help you sketch the price path from production to the customer. They do not guarantee a sale or a margin. Your costs and customer’s willingness to pay still matter.
| Sales role | Starting cost or price | Multiplier | Resulting price range or example | Pricing assumption |
|---|---|---|---|---|
| DTC brand | Landed cost | 3-5 times | $30 cost gives $90-$150 | Rough direct-sales example |
| Wholesale brand | Landed cost | 2.0-2.5 times | $30 cost gives $60-$75 | Rough brand starting range |
| Retailer | Wholesale price | 2.2-2.5 times | $60 wholesale gives $132-$150 | Rough retail starting range |
A DTC-only price may work for your own store but leave little room for a future retailer. A wholesale-ready retail price must still make sense to the intended customer. A high price that does not fit the product or audience will not fix weak sales.
Check whether the same style can serve both channels
Think about where your target customers shop and what price they expect. A brand that tries to serve every channel at once can spread its marketing and operations too thin. A focused audience and sales channel can make your pricing test more useful.
If you plan to sell DTC, your online store must support clear product pages, payments, and fulfillment. A guide to building a Shopify store can help you think through that sales setup.
Price comparisons should use the final amount customers pay, not just a ticket price or advertised discount. For example, shoppers weighing an outlet price against the regular product may compare the actual offer and return terms. Test the proposed retail price with the intended customer before treating the channel ladder as viable.
What Can an Apparel MOQ Apply To?
An MOQ is useful only when the factory clarifies exactly what quantity it applies to. The minimum order quantity may apply to an order, style, color, or size. Ask what the number counts before comparing it with your inventory plan.
One quoted minimum can hide separate minimums for fabric, trims, colors, and finished units. A factory may accept a small total order but require a larger quantity of one material or color. That difference can leave you with unused supplies or more clothing than you can sell.
Check which quantity the factory is quoting
Confirm whether the MOQ is per order or per style. Then ask whether it applies to each color or size. A total that sounds manageable may become much larger when you multiply it across several colors.
Identify material and color minimums
Material orders can drive the garment count. Custom dye lots for a 6 oz polyester-spandex blend may require 1,000-2,000 yards. That yardage can lead to production minimums of 1,000-2,000 pieces per color.
Send the factory these four questions before you sign off:
- Which quantity does the MOQ apply to?
- Do different colors have separate minimums?
- Do you set minimum quantities for each size?
- Can the material minimum be shared across styles?
Ask how unused fabric or trim will be handled if the order uses less than the full material amount. Some materials may not suit another style or later season. Compare the required fabric or trim commitment with the number of finished units you can realistically sell.
When Does a Larger Production Run Improve Margin?
A larger run improves the unit-cost calculation when the savings from spreading fixed setup work exceed the added inventory risk. Pattern grading, marker creation, cutting preparation, sewing-line setup, and machine calibration can all create fixed costs. Those costs do not rise one-for-one with each garment.
More units can lower the setup amount assigned to each garment. By contrast, fabric, trim, and sewing costs usually grow with the number of pieces. Keep those variable costs separate from one-time setup work.
For a simple arithmetic example, spread the same fixed setup amount across 100 units, then across 1,000 units. The per-unit allocation across 1,000 is one-tenth of the amount assigned across 100. This example shows the effect of volume without assuming a specific factory quote.
A lower setup cost per garment does not prove that a bigger order will earn more profit. You must still sell the added units, and demand can be hard to predict for a new product or color. Unsold stock can tie up cash and take room that another style needs.
Use a smaller run when it gives you a better test of demand, even if each garment costs more. A larger run may make sense when expected sales support the quantity and the total cash commitment fits your plan. Compare the lower cost per unit with the full amount of cash tied up in the larger order.
Which Costs Reduce Margin After Production?
A style can meet its planned gross margin at full price and still lose margin through returns, discounts, and order-level expenses. Returns can bring shipping and handling costs, while some returned garments cannot be sold as new. Sales after production change the result.
Contribution margin equals revenue minus COGS minus variable selling costs. Gross margin measures product revenue after cost of goods sold. Contribution margin also subtracts costs that rise with sales, such as payment processing and order fulfillment.
Account for returns and damaged units
DTC apparel returns commonly range from 25%-40%; some dresses and fit-sensitive items reach 50% or more. Return shipping commonly costs $5-$15 per return, while receiving and inspection costs $2-$5. About 10%-15% of returned items may not be resellable as new.
Inventory shrinkage commonly runs 1%-3% of inventory at cost. Shipping, returns, or warehouse damage can add another 1%-2%. Track damaged and unsellable stock as a cost, not as ordinary saleable inventory.
A $100 retail item with a $30 landed cost starts with a 70% gross margin before returns. With a 30% return rate, processing costs, and damaged inventory, realized margin can fall closer to 45%. The exact result depends on which units return and whether they can be sold again.
Model markdowns and variable selling costs
Promotional discounts commonly range from 20%-40%. A 25% blended discount can reduce a 70% list margin to about 55%. Estimate the share of units sold at full price, on promotion, or at a deeper markdown.
Payment processing is typically 2.9% plus $0.30 per transaction. Pick and pack often costs $2-$5 per order, and outbound shipping commonly costs $6-$12 per order. These fees belong in your estimate of profit after the garment sells.
Review these five points in your sales forecast:
- Discount mix across full-price and promotional sales.
- Return shipping cost per returned order.
- Receiving and handling cost for each return.
- Damaged inventory that cannot sell at full price.
- Per-order selling fees, including payment and fulfillment.
Rewards can also affect the cost of a sale. A loyalty offer’s cost and repeat-sale effect belongs in contribution, not just gross sales. Product-image work may add to selling costs too, including tools for preparing e-commerce images.
Base the forecast on the expected blended selling price, not only the ticket price on the first day of a launch. A real selling price accounts for promotions and the mix of units that may return.
How Can Profitable Inventory Still Strain Cash Flow?
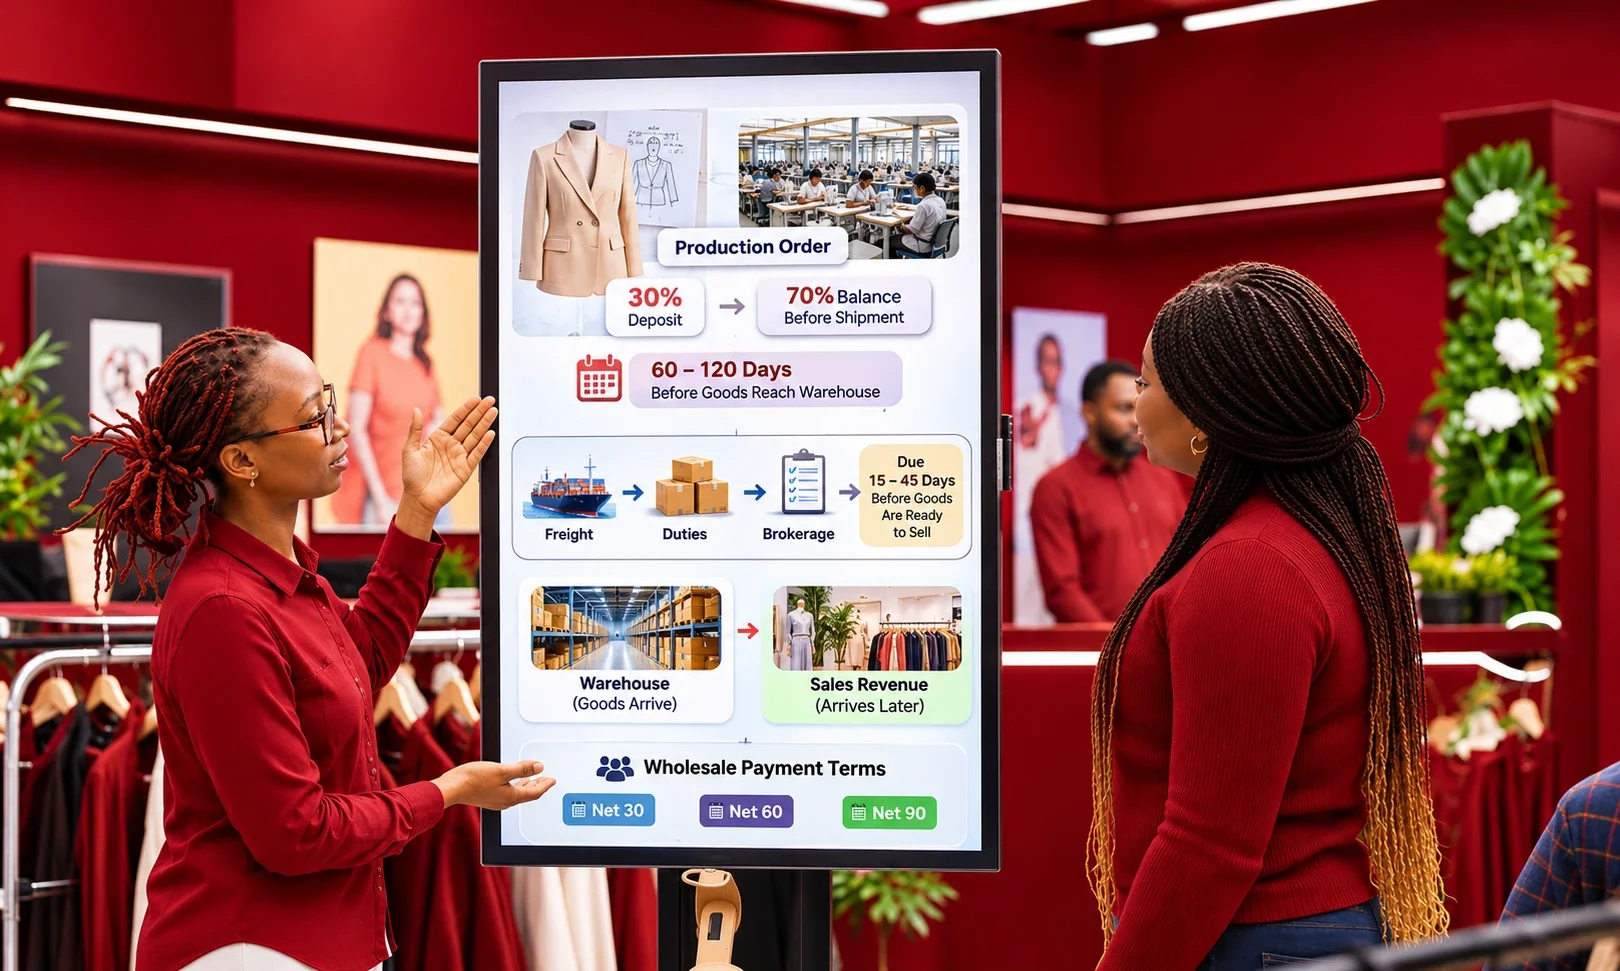
A style can show a positive product margin while requiring cash months before its first sale. Factories may ask for a 30% deposit, with the balance due before shipment, often 60-120 days before goods reach your warehouse. Sales revenue arrives later.
Map each production bill against the expected date of customer payment. Freight, duties, and brokerage can be due 15-45 days before goods are ready to sell. Wholesale customers may pay on Net 30, Net 60, or Net 90 terms.
Map cash paid before the sale
Write the expected events in order: factory deposit, balance before shipment, freight and customs payments, then warehouse arrival. The bills may fall due before the inventory can earn revenue. Include the timing of freight and brokerage alongside the production schedule.
A useful cash conversion cycle tracks the time between paying for inventory and receiving payment from its sale. The cash conversion cycle can help you see how inventory days, receivable days, and payable days affect working cash.
Compare customer payment timing with production timing
Wholesale terms can stretch the wait after delivery. Net 30 means payment is due 30 days after the invoice date, while Net 60 and Net 90 extend that wait. Returned orders can create another delay, since customer returns may arrive 30-60 days after a sale.
Factoring can speed up access to wholesale receivables, but fees commonly take 1%-2% of invoice value. Include that fee when you compare the faster cash with the money you give up. A planned marketing budget can also separate firm costs, flexible spend, and cash reserves.
Check that available working cash covers the production and import bills before the expected customer payment date. A profitable order can still strain your business if the bills arrive before the revenue.
What Margin Benchmarks Fit Each Apparel Business Model?
A useful margin target depends on whether your brand sells primarily DTC or wholesale. In January 2026, U.S. public apparel companies averaged 56.88% gross margin, 9.11% operating margin, and 3.85% net margin. Business model matters.
Use benchmarks as planning checks, not guaranteed results. Healthy DTC apparel targets are typically higher than wholesale gross margin targets. Operating and net margins measure more than the product’s sale price minus its cost.
Compare public-company averages with brand targets
The January 2026 NYU Stern industry database covered 35 public apparel firms. Their scale and business mix differ from a small private brand, so the averages are context, not a promise for your business.
| Margin measure | January 2026 public apparel average | Healthy DTC target | Healthy wholesale target |
|---|---|---|---|
| Gross margin | 56.88% | 60%-75% | 40%-55% |
| Operating margin | 9.11% | 15%-25% | 8%-15% |
| Net margin | 3.85% | 8%-15% | 4%-8% |
Set separate gross, operating, and net goals
Gross margin focuses on product revenue after cost of goods sold. Operating margin shows what remains after operating expenses. Net margin reflects what remains after the business’s full set of expenses and other costs.
A brand can have a strong product gross margin and still post a low net margin. Rent, payroll, marketing, and other expenses affect the company result. Separate goals help you see whether a style’s economics or broader business costs need attention.
Use the DTC or wholesale range that best matches how you sell, then compare it with your own expenses. Treat the benchmark as a prompt to test your own channel costs, not as a substitute for a style-level forecast.
How Can You Stress-Test a Style Before Approving It?
A style is ready for a production decision only when its current-run cost and likely selling price work together. Build one cost sheet from the actual quote and another from a future scaled-run quote. Test both cases against the margin you need.
Calculate the price required by each cost sheet, then compare it with what customers will pay. The target-price formula is landed cost divided by one minus the target gross margin. Use the same target and cost basis in both scenarios.
Build a current-run and scale scenario
For each sheet, include the cost expected at that run size. Keep confirmed quotes distinct from estimates, then compare the resulting required price. Do not assume that a hoped-for future discount applies to the current order.
A heavyweight T-shirt with a $7.75 total unit cost needs a $22.14 selling price for a 65% DTC gross-margin target. At a 50% wholesale gross-margin target, the same cost produces a $15.50 wholesale price. If a retailer doubles that price, retail is about $31.
Test the required selling price against demand
Compare the calculated price with similar products and the customer’s expected value. Clear product photos can help shoppers judge fit, fabric, and details; these e-commerce photography practices can support that review. Your store setup also affects how buyers see and order the style, so include the online sales experience in your customer test.
Use five checks before approving the order:
- Quote inclusions match the product and production work.
- Landed cost fits the chosen selling price.
- Each intended channel has workable economics.
- Expected realized price accounts for discounts and returns.
- Available cash covers the order and import bills.
If customers do not see enough value at the required price, the style needs a change before bulk production. If the required price fails the customer test, revise the product specification or production plan before approving the order.
Which Product Changes Can Protect Margin Before Production?
Small design choices can create recurring unit costs when they appear on every garment in a production run. Review fabric use, trims, construction, finishing, packaging, and testing before bulk production. Small changes add up.
Change a cost driver only when the product still delivers the feature customers value most. A simpler trim or sewing operation may lower cost, but removing a key fit or finish can weaken the product. The goal is a better cost without an unwanted drop in quality.
Labor cost grows with time on the sewing line. A garment that takes 20 minutes to sew at a labor rate of $15 per hour has a $5 labor cost per piece. A more complex seam or added pocket can increase that time across every unit.
Review each trim by asking what job it does. A decorative button may be replaced with a simpler option if the look stays right. A functional closure that customers rely on deserves a closer quality test before you change it.
You can also simplify a sewing operation without changing the garment’s main shape. Reduce a seam or move a detail only if the sample still fits and wears as intended. Packaging may be another place to adjust, such as using a simpler bag while keeping the garment protected.
A costly finish may not be essential to the customer’s main reason for buying. Test a lower-cost finish beside the original sample and compare feel, color, and wear. Keep testing costs visible, since removing a test does not remove the risk it was meant to catch.
Protect the feature customers notice and value most before cutting a detail to save a few cents.
Product images also shape how shoppers judge the finish and details. If a changed trim looks different online, the photos may need to show that difference clearly. Change one specification at a time and confirm its cost and quality effect before signing off on the final sample.
Conclusion
Your margin estimate is only as reliable as the cost assumptions and selling-price scenario behind it. A factory quote can make a style look profitable until added materials, delivery, or channel costs change the result. Keep the price tied to the cost basis you actually expect.
Before production, compare the likely price with customer demand and the cash your business can commit. A sound decision protects the brand from ordering units that only work on paper. Update the cost sheet with confirmed factory, material, and freight quotes, then hold the production decision until the proposed price supports the intended channel.