


The 60/40 brand performance split is usually presented as a simple budget rule: put about 60% into long-term brand building and 40% into short-term activation. But that number came from effectiveness research as an average across many situations, not as a law every brand should follow.
The important question for a 2026 budget is not whether 60/40 is right or wrong. This should move your budget away from the average.
Key Takeaways
- 60/40 came from research into the different short-term and long-term effects of marketing.
- Later analysis found an overall optimum of about 62:38 but also showed wide variation by context.
- Financial services showed an 80:20 optimum while other services were closer to 51:49.
- Brand size, category growth, purchase method, pricing, and innovation can all change the balance.
- For 2026 budgets, 60/40 works best as a starting point rather than a fixed prescription.
Where the Rule Came From
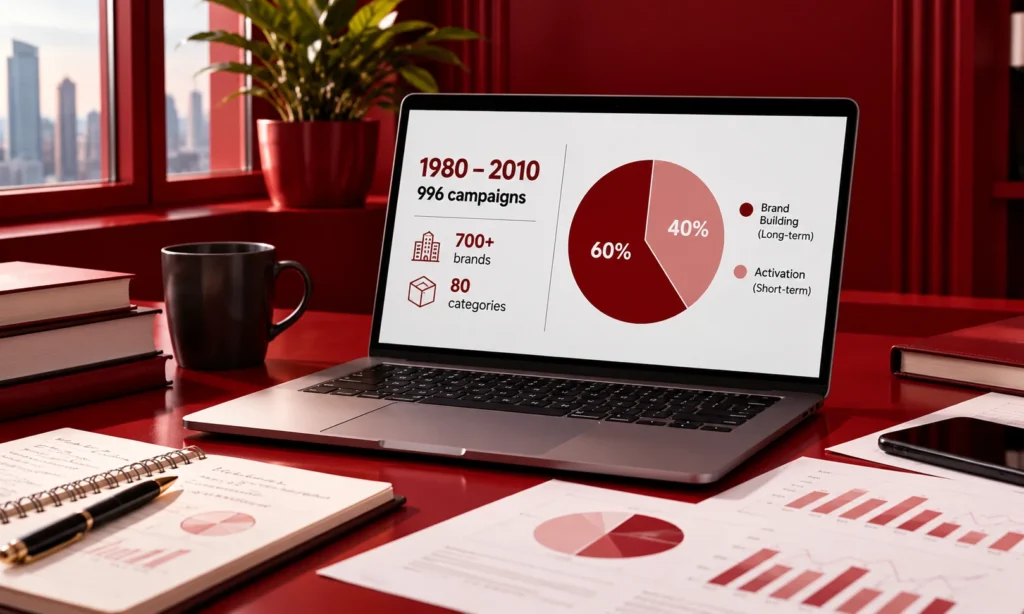
The 60/40 idea comes from research by Les Binet and Peter Field using the IPA Effectiveness Databank. Their analysis behind The Long and the Short of It examined 996 campaigns entered into the effectiveness awards between 1980 and 2010. The cases covered more than 700 brands and 80 categories. The research separated two jobs that marketing needs to perform.
Brand building creates effects that develop over a longer period. It can strengthen familiarity, preference, pricing power and other forms of brand equity. Activation is more closely connected to immediate sales response. It can capture existing demand and produce faster commercial effects.
The point was never that one side replaces the other. The research found that brands need both because the effects happen on different timescales. The average balance came out at roughly 60% brand building and 40% activation.
Later research using IPA Databank cases from 1998 to 2016 refined the overall balance to 62:38. That is close enough to 60/40 to show that the broad principle remained remarkably stable. It also gave marketers a more important warning: the optimum changes when the context changes.
That distinction matters. The research supports a broad balance between long-term and short-term marketing. It does not support taking one average and applying it unchanged to every business.
What It Actually Said About Variation
Does the 60/40 balance apply to every category? No. The research found that the balance changes because brand building and activation do not have the same level of difficulty in every market. Category conditions, buying behaviour, pricing, innovation and brand size can all change the relative contribution of each activity.
The overall 62:38 figure therefore works best as a reference point. The useful part of the research is what happens when you move away from that reference point.
Categories that sit above average
Some industries benefit more from brand investment than others. Financial services had an optimum split of 80:20, compared with 69:31 for non-automotive durables and 64:36 for retail. These differences show how industry conditions influence marketing effectiveness. Consistent investment in brand building can also support long-term brand growth.
The differences become even larger when we look beyond broad sectors. A brand entering a new category had an 84:16 optimum. A new sub-brand was 78:22. Small brands were 75:25 while online, and subscription businesses were both 74:26 in the research.
These figures should not become a new list of rules. A company selling online should not simply copy 74:26 because another online business had that research benchmark. The lesson is more useful than the number: the context can move the balance substantially away from 60/40.
Categories that sit below it
The reverse is also true. Other services had an optimum of 51:49. FMCG food and drink was 56:44, while durables overall were 58:42. A value or mainstream positioning was also associated with 57:43.
Category life stage matters too. New categories showed 65:35, while established categories were 62:38. Declining categories moved to 58:42, while medium or high-growth categories reached 73:27.
The spread is the important finding. If the research can produce balances ranging from roughly 51:49 to 80:20 across sectors, then calling 60/40 a universal rule hides information that can materially change a budget. Quoting the average without the variation is therefore only half the story.
Why the Number Became a Rule Anyway
There is a good reason 60/40 survived. It is simple. It is close to the overall research result. It gives marketers a clear starting point when a budget meeting needs an answer, and there is not enough evidence to build a more detailed model.
The problem starts when a useful starting point becomes a fixed target. The research itself continued to describe 60/40 as a broad optimum while later work added context around it. That means the memorable number was not the problem. The problem was treating the summary as the complete finding.
This also explains why the brand vs performance budget debate can become unproductive. The question should not be which side wins. Both sides perform different jobs, and the balance between them depends on the situation. A better budget meeting starts with the average and then asks what makes this brand different.
What Has Changed Since
The underlying research has not suddenly become irrelevant. What has changed is how marketers measure and manage the work. Short-termism became more common in the later years of the research. In high-research categories, the share of short-term campaigns rose from 14% in 2008 to 38% in 2016. In low-research categories, it increased from 9% to 23%.
The average number of very large business effects rose from 1.2 in 2002 to 2.0 in 2008 before falling to 1.45 in 2016. The research showed short-termism rising as effectiveness declined. That does not prove that short-term campaigns alone caused the decline, but it shows why the balance between short-term and long-term marketing still matters.
The measurement challenge has also evolved. Marketers now have more rapidly updated performance signals available to them, which can make immediate results easier to assess than effects that take longer to appear. The challenge is making sure those fast signals do not become a substitute for measuring broader business effectiveness.
Scale Still Matters
Newer evidence makes the issue especially relevant to 2026 budget planning. An analysis of IPA Effectiveness Award-winning cases found that budget explained 89% of the variation in payback, while ROI accounted for 11%. The analysis reinforces the point that efficiency measures alone should not determine how marketing budgets are allocated.
That creates a familiar trap. Tighter targeting can improve efficiency, but greater efficiency does not automatically mean greater overall effectiveness. The newer research found that narrowly focused approaches can increase efficiency while reducing effectiveness, reinforcing the importance of budget, reach, and scale.
The 2026 lesson is not that performance marketing is bad. It is that efficiency and effectiveness are not the same thing. Marketing budgets need enough scale and enough time to support both immediate activation and longer-term business effects.
Where the Split Does Not Apply
The better question is not where 60/40 “does not apply.” It is where the starting point needs to be adjusted. The research gives several reasons to adjust it. A major innovation can require more brand investment. Entering a new category produced an 84:16 benchmark, while a new sub-brand produced 78:22. Medium or high-growth categories were also at 73:27.
Purchase behaviour can change the balance too. Offline purchasing was associated with 55:45, while online and subscription purchasing were both 74:26 in the research. That is a useful warning against assuming that digital buying automatically means a performance-heavy budget. Brand size needs more care than a simple startup rule suggests.
The research showed a 75:25 optimum for small brands but a very different 35:65 balance for launches in their first one to two years. That does not mean the research is contradictory. Brand size and launch stage are different conditions that can push the budget in different directions. This is why a startup should not be given a blanket 60/40 answer either way.
A new company needs to ask whether it is launching a new brand, entering a new category, building awareness in an established market or trying to capture existing demand. Those are different problems, and they should not receive the same budget formula.
How to Set Your Own Split
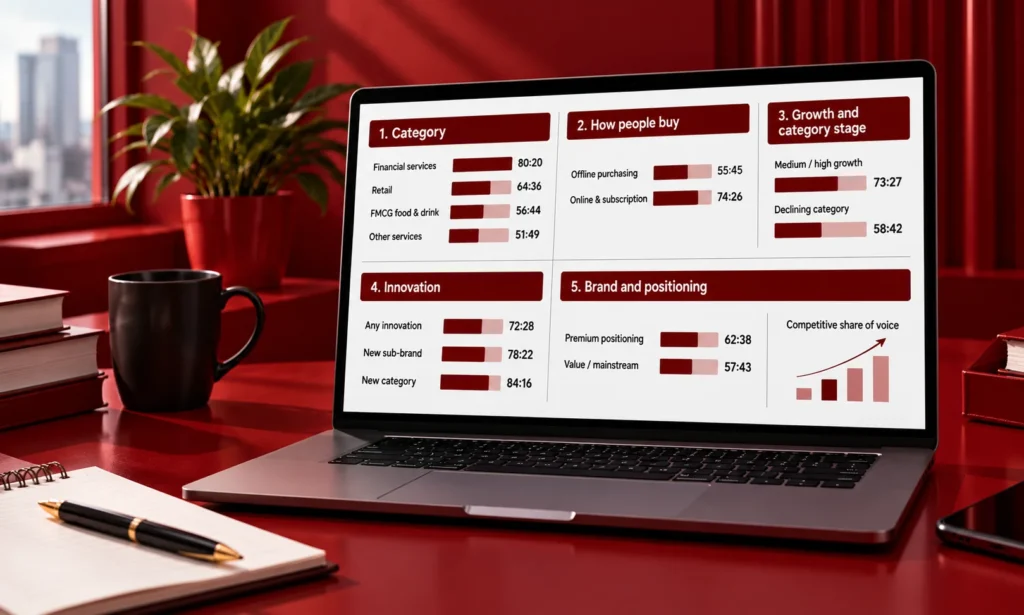
Start with 60/40 if you have no better evidence. Then test the context before you lock the budget.
1. Check your category
Start with the relevant sector benchmark. Financial services was 80:20. Retail was 64:36. FMCG food and drink was 56:44. Other services was 51:49. These figures show why the first question should be where your business sits rather than what the universal ratio is.
2. Check how people buy
Purchase behaviour can move the starting point. The research found 55:45 for offline purchasing and 74:26 for online and subscription models. Treat these as evidence for adjustment rather than numbers to copy.
3. Check growth and category stage
A growing category can justify a stronger brand-building position. The research put medium or high-growth categories at 73:27, while declining categories were at 58:42. That difference tells you to look at the market’s direction before setting the split.
4. Check innovation
Innovation can increase the need to explain what the product is and why people should care. The research showed 72:28 when there was any innovation. A new sub-brand moved to 78:22, while entering a new category reached 84:16.
5. Check your brand and positioning
Your positioning matters because it changes the job marketing has to perform. Premium positioning showed 62:38, while value or mainstream positioning showed 57:43. Brand size also produced large differences in the research.
Then consider your competitive share of voice. If competitors are spending heavily while your brand is becoming quieter, a small efficient campaign may not be enough to protect future demand. The effectiveness research has consistently treated share of voice and share of market as important parts of the brand growth equation.
This gives you a practical context check: Category → buying model → growth → innovation → brand size → positioning → competitive share of voice. You can use the result to explain why your budget sits above or below the 60/40 starting point.
How to Defend It
The strongest way to defend a budget is not to say, “The research says 60/40.” That is exactly the mistake this article has exposed. Instead, say: “60/40 is our starting point. Here is the evidence that moves us away from it.”
Show the category benchmark. Then show the buying model. Explain the growth stage and innovation. Add the brand’s competitive position and share of voice. That turns the budget from an opinion into a reasoned decision.
The newer effectiveness research also gives CMOs another useful argument. If budget accounts for 89% of variation in payback in the analysed cases while ROI accounts for 11%, then improving efficiency alone cannot be the whole budget strategy.
This matters to the CMO remit because the CMO is not only responsible for finding cheaper conversions. The job is to allocate enough investment to create profitable growth over the appropriate time horizon. That also changes how success should be measured. The right CMO scorecard metrics can help connect marketing investment with business outcomes.
Activation should be judged on the outcomes it is designed to produce quickly. Brand building needs measures that can capture changes in awareness, consideration, preference, pricing power, and other forms of brand equity over a longer period. The question is not whether one measurement system wins. It is whether the measurement plan matches the job the money was assigned to do.
The Read
So, should marketers retire the 60/40 rule? No. They should retire the idea that 60/40 is the answer before the context has been examined. The evidence still supports a broad balance around 60% brand building and 40% activation.
Later analysis found 62:38 across contexts and newer effectiveness research continues to argue against replacing long-term investment with narrow short-term efficiency. What the research does not support is pretending that every category, brand and business situation needs the same split.
Financial services can sit at 80:20. Other services can sit around 51:49. A new category can move to 65:35 while a new-category launch can reach 84:16. A first-year launch can even move heavily toward activation while the broader small-brand benchmark points toward brand building.
That is why the 60/40 brand performance split is still useful in 2026. Use it as the starting line. Then work out where your brand sits in the variation range before you decide where the money goes.