Assess each proposed style before ordering by stress-testing its demand, supplier, size-curve, and cash risks, then buy only against a documented plan for replenishment or leftover stock. Inventory risk is the chance that a buying decision leaves a business with too much, too little, or the wrong mix of sellable goods.
Trends, seasonal timing, variant-level demand, and supplier delays can turn a sound total buy into a mismatch of sizes, colors, and channels. A jacket may sell well overall while certain sizes sit, or a delivery may arrive after its best selling weeks have passed.
Look beyond the total when you judge customer demand and planning. A practical assessment connects likely sales with what suppliers can deliver, the assortment customers need, and the cash your business can carry.
You will make stronger buying decisions when you can see where the order could fail and what you will do about it. Each style-color-size variant is a SKU. Unsold goods held for sale are merchandise inventory.
A useful buying decision protects the chance to sell well without committing more cash than the business can carry.
Key Takeaways
- Assess demand by SKU, channel, and selling period.
- Separate recorded sales from demand hidden by stockouts.
- Check supplier dates against the season’s selling window.
- Size opening orders around confirmed demand and available cash.
- Plan replenishment or a route for leftover merchandise inventory.
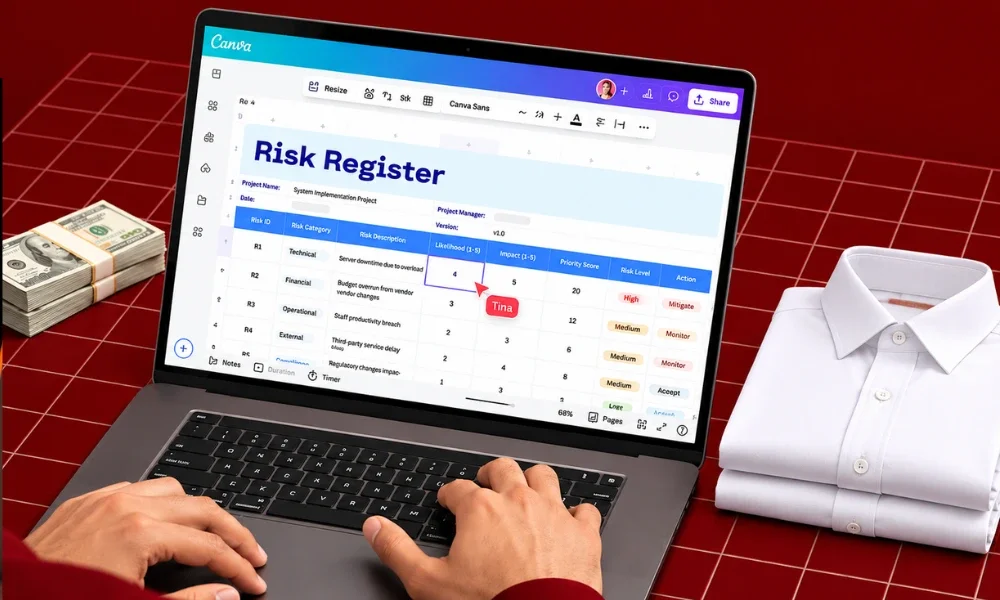
Start by recording each candidate style’s chance of a miss, financial impact, and how early the team could detect it. Rate each style across demand, supply, and execution, rather than treating inventory management as one broad concern.
A style can be high risk even when a miss seems unlikely, if the financial impact would be large. ISO 31000 risk-assessment concepts use likelihood and consequence to organize decisions. A low, medium, or high rating works when the team writes down its reasoning.
Demand and assortment exposure
List candidate styles, then note demand and assortment risks separately. A fast-moving trend may fade before delivery, while a style’s total sales can hide weak demand for a particular size or color.
Record risks by channel, too. A style planned for both wholesale and direct-to-consumer sales may have different timing, size needs, and order certainty in each channel.
For an assortment decision, consider whether materials, construction, durability, and price support the intended value. This product quality and value guide also contrasts lasting classic designs with trend-heavy pieces that may date faster.
Supply and execution exposure
Keep supply and execution risks in their own fields. Execution risks can include poor handoffs, incorrect item data, or slow approval steps that delay a response.
Assign an owner and review date to every risk. The owner should know what signal would change the rating and who needs to hear about it.
Flag a style for closer review when a late warning would leave too little time to change the order or allocation.
Use the register to show why a risk matters, not just to color a cell. A low likelihood with a severe cash impact deserves a clear explanation.
Apparel supply-chain research examines demand and supply uncertainty, supplier performance, transport, resource scarcity, information sharing, and political change. Those risks can affect a style in different ways.
What demand data should you check before buying?
A useful demand estimate starts with clean sales history separated by style, size, color, channel, and selling period. Observed sales are not always demand, because a stockout can prevent a willing customer from buying.
Use up to 24 months of clean history when available, then adjust for factors that make periods hard to compare. Markdown weeks, promotions, campaigns, unusual weather, and stockouts can all distort the pattern.
Clean history and comparable products
Review variant-level sales, sell-through, returns, price state, and regional results. Sell-through shows how much of the available stock sold during a period.
Keep the forecast’s unit and time period clear. A weekly view may suit a fast seasonal launch, while a longer view can help with styles that sell steadily.
Separate confirmed wholesale purchase orders from possible reorders and direct-to-consumer plans. A confirmed order is a firmer signal than a reorder that has not been placed.
New styles, stockouts, and channel signals
For a new style, compare it with a similar product and state the assumptions behind that match. Similar fabric, fit, price, and season can make the comparison more useful.
Use preorders and waitlists as signals, not guaranteed sales. A customer who joins a list may still change their mind or buy elsewhere.
Member sales also need care: enrollment and purchases alone do not prove that a loyalty program created new demand. Compare similar customer groups to see whether rewards changed buying behavior and contribution margin.
Set the planning calendar by working backward from supplier lead time and approval. One preseason example starts 16-20 weeks before launch, with weekly forecast reviews during a fast seasonal launch.
Choose the history period and review pace to fit the collection and data quality. Save the data cutoff and the assumptions alongside each forecast so later reviews compare like with like.
How do you rank styles by inventory value?
ABC analysis ranks products by annual consumption value, not by how visually prominent or fashionable they seem. Start with value: multiply annual units sold by unit cost or revenue per unit.
Rank items from highest to lowest value, then assign classes by each item’s cumulative share of total value. A class points to products that deserve closer buying attention, not products that are automatically safe or risky.
Here is one example using annual value. Its total is $132,000, so each item’s share reflects its part of that amount.
| SKU | Annual value | Share of total value | Class |
|---|---|---|---|
| SKU 101 | $60,000 | 42.9% | A |
| SKU 102 | $36,000 | 25.7% | A |
| SKU 103 | $15,000 | 10.7% | B |
| SKU 104 | $12,000 | 8.6% | B |
| SKU 105 | $9,000 | 6.4% | C |
Read the classes as guides
One rule of thumb puts A items at 10-20% of items that generate 70-80% of revenue. It places B items near 30% of items and 15-20% of revenue.
The same guide puts C items at 50-60% of items and 5-10% of revenue. These are guidelines, not universal cutoffs; a fashion example instead uses cumulative turnover below 40% for A and above 80% for C.
ABC can use past sales, forecast sales, or both. One method pairs three months of history with nine months of forecast, while ABC-XYZ analysis adds a way to account for volatility.
ABC alone does not measure variation. A low-value style with uneven sales is not automatically safe to buy in depth.
Recheck class assignments when the planning horizon or sales mix changes.
Which fashion supply-chain risks can delay or distort an order?
A product can be forecast correctly and still become a risky buy if production or shipping misses its selling window. Check the whole route, from materials and factory capacity through freight and delivery.
A supplier’s quoted date is not the same as a confirmed available-to-sell date. Build time for production, transit, receiving, and any needed checks, then see how much selling time remains.
Supplier timing and production constraints
Lead-time variation can come from limited factory capacity, fabric or trim shortages, labor gaps, and production delays. A small change in one input can push a finished style past its planned launch.
Freight bottlenecks can also shift the arrival date. Geopolitical events and natural disasters may interrupt routes, materials, or factory work.
In 2025, only 13% of businesses surveyed by QIMA reported full sourcing-network visibility, including raw materials. Full sourcing-network visibility can be hard to gain when production depends on suppliers beyond the first tier.
Visibility beyond the first tier
A direct supplier may not control every mill, trim maker, or subcontractor. Ask what parts of the chain the supplier can see and which delays it can report early.
Global retail supply-chain incidents more than doubled since 2020 and rose 22% between 2024 and 2025. Fashion accounted for 5% of nearly 17,000 unique global supply-chain risk incidents over five years.
An apparel supply-chain study covers risks such as transport problems, resource limits, supplier performance, and political changes. The categories help teams discuss where one delay might affect a planned order.
Record the latest useful delivery date, not just the expected arrival date.
What should you verify with a supplier before production?
A barcode that scans is not proof that the label identifies the correct garment or shipment. Check the encoded identity against the approved product record before production starts.
Agree on the product data, label, inspection, records, and failure process before goods are made. GS1 US explains how standard identifiers and data exchange can support inventory visibility across trading partners.
Agree on product and barcode information
Use these five preproduction checks to set a clear apparel process:
- Confirm the barcode data source and approve the artwork.
- Agree on required product and order fields.
- Approve the physical label and its placement.
- Define inspection coverage and test conditions.
- Document records and the steps after a failure.
Required fields may include style, size, color, purchase order, carton, and destination. A readable code can still name the wrong style, size, color, purchase order, carton, or destination.
Set inspection and failure rules
Decide whether inspection covers every defined unit or uses sampling. A sampling plan should name the lot, selection method, sample size, acceptance rule, and escalation trigger.
For example, define which production batch counts as the lot and who chooses sample units. State what result stops shipment, prompts a larger sample, or requires a correction.
Keep test conditions and records clear enough for both teams to repeat the check. A photo, scan result, or signed sample record can help track an approved decision.
Approve a physical sample against the agreed product record before the production run proceeds.
How should you size the opening buy and replenishment plan?
Size the opening commitment against demand by style, size, color, channel, and period, then keep confirmed orders separate from possible demand. Build the plan at SKU level, rather than spreading a style total evenly across sizes.
Presales, a smaller opening buy, and stock orders supported by replenishment each trade certainty for flexibility. Choose the mix that fits the selling window and the supplier’s ability to respond.
- Presale commitments give you earlier order signals from customers or retail partners.
- A smaller initial buy or test batch limits the first commitment and preserves room to react to actual sales.
- Stock orders backed by replenishment support steady sales when more units can arrive in time.
A small test does not help when supplier lead time leaves no realistic reorder window. In that case, the opening buy must cover more of the likely season demand.
For wholesale planning, separate confirmed purchase orders from forecasts, expected reorders, and cancellations. Do not treat a hoped-for reorder as a firm order.
Assign stock by channel with explicit reserves. A planned reserve keeps one channel from promising units that another channel already needs.
Retailers using Shopify can manage inventory alongside their online store. Shopify store setup and maintenance also covers in-house fulfillment, dropshipping, and third-party logistics choices.
Reserve replenishment capacity only when the supplier’s timing can still meet the remaining selling window.
What inventory system checks reduce ordering risk?
Test the system against your real style-size-color structure and order flow, not just a product-feature list. Use your own products to see whether inventory management keeps warehouse and channel availability aligned.
Test a full size run, a scan-to-availability update, and whether a wholesale order changes what your web store can sell. AIMS360 combines style, color, and size in its apparel inventory record and supports bin locations, handheld scanning, cycle counts, and GS1-128 labels.
Confirm apparel-specific product structure
These systems handle apparel data and warehouse work in different ways. The right fit depends on your product records, order volume, and need for outside connections.
| System | Apparel structure | Warehouse capability | Configuration or integration caveat |
|---|---|---|---|
| ApparelMagic | Native style and size grids | Inventory and warehouse functions | Lighter deep-warehouse execution as volume grows |
| Uphance | Prepacks and size runs | Warehouse management | Native EDI for trading partners |
| NetSuite | Apparel grid often needs setup | WMS is a module | Retailer EDI usually needs a connector or partner |
| Cin7 | SKU-based model | Inventory tools | Apparel grids, prepacks, size runs, and wholesale terms need setup |
| Extensiv | General SKU model | Strong WMS | Production, costing, and wholesale terms need another system |
ApparelMagic has apparel-native grids, while Uphance supports prepacks, size runs, warehouse management, and native EDI. NetSuite’s apparel grid often needs configuration or a vertical add-on.
Cin7 needs setup for apparel grids, prepacks, size runs, and wholesale terms. Extensiv offers a general SKU model and strong warehouse management, while production, costing, and wholesale terms need another system.
Test the live order-to-availability workflow
Ask the demo team to load one full size run, scan a real item, and place a wholesale order. Check whether each change updates the web store’s available quantity.
Compare the product identifiers, attributes, price, and availability that your sales channels receive. Reliable product and availability data can inform shopping results, though complete information does not guarantee visibility.
Record the refresh timing and exceptions that the team would have to reconcile manually.
How can you keep stock records accurate during the season?
Keep stock records accurate by matching regular physical checks to the warehouse’s barcode-level records. Count by variant, because similar garments can differ only by size or color.
Recount and review transactions before calling every difference shrink. A mismatch may come from misplaced units, incomplete transfers, incorrect shipment quantities, or returns that were not processed.
Count strategically without stopping daily work
A full physical count covers all warehouse items at once and usually stops operations. Cycle counting checks a subset daily or weekly while other work continues.
| Count method | Coverage | Timing | Operational interruption |
|---|---|---|---|
| Full physical count | All warehouse items | Usually once or twice a year | Usually stops operations |
| Cycle count | A selected subset | Daily or weekly | Work continues |
One fashion example counts A items monthly and C items every six months. Unique scannable barcodes help distinguish apparel variants that look nearly alike.
Older stock can be easier to find when the warehouse labels and places it for rotation. The FIFO method puts older goods first, which can help reduce waste and obsolescence.
Investigate discrepancies, theft, and returns
Recount the location, then review receipts, transfers, shipments, and return records. Compare scan history with transaction times before changing the recorded quantity.
NRF reported a 1.6% average U.S. retail shrink rate of sales and estimated $112.1 billion in retail shrink losses for FY2022. Internal and external theft together made up nearly 65% of shrink among retailers surveyed for that fiscal year.
In July 2026 research, participating retailers reported 12.4% fewer shoplifting incidents and 8.1% fewer merchandise-theft incidents in 2025 than in 2024. NRF projected $849.9 billion in U.S. merchandise returns for 2025, with 19.3% of online sales returned and 9% of all returns fraudulent.
Keep inspected returns out of sellable availability until you verify their condition and variant. Return inspected goods to sellable availability only after their condition and variant have been verified.
What should you do with unsold inventory?

Decide how slow-moving goods could be sold, donated, or reused before the season ends, rather than waiting until storage pressure forces a rushed choice. Set an exit route early so leftover stock does not force a rushed markdown.
Merchandise generally remains an asset while unsold, and its cost usually enters cost of goods sold when sold. The basic formula is Beginning Inventory + Purchases – Ending Inventory = COGS.
Choose an exit route before the season ends
Options include a planned markdown, an outlet or secondary channel, donation, or reuse. Liquidation can cut margin and may change how customers view the brand.
Outlet pricing is not always a direct comparison with a full-price item, since some goods are made for outlet sales. Compare the actual product, final price, materials, and construction before judging the offer. This outlet buying guide also notes that return rules can differ.
Fashion excess stock in 2023 was estimated at 2.5-5 billion items, with a sales value of $70-$140 billion. A planned exit route helps you make a choice before storage space becomes the main concern.
Keep U.S. tax treatment separate from EU disposal rules
The EU ban on destroying unsold clothes and shoes applies to large companies from July 19, 2026, and medium-sized companies from 2030. It is not a U.S. disposal requirement.
Covered EU businesses using destruction exceptions must keep records for five years. They must prioritize selling, donating, or preparing goods for reuse before destruction.
Qualifying U.S. small businesses may use inventory exemptions if they meet an average annual gross receipts test. Thresholds described in 2021 are more than two years old, so check current IRS guidance or a tax professional before relying on an exemption.
What is the final test before approving an order?
Approve the order only after the downside case fits the business’s cash and the supplier’s timing still supports the selling window. Compare three demand cases: downside, base, and upside.
A strong base case is not enough if the downside would exceed the business’s cash capacity. Review the open-to-buy decision against the order commitment, expected margin, available cash, and latest useful decision date.
Stress-test the financial commitment
Use this four-item approval checklist before committing:
- Check cash exposure in the downside case.
- Estimate margin after likely markdowns.
- Confirm the supplier’s minimum commitment and latest useful reorder date.
- Name who can approve a staged, reduced, or full order.
These are decision criteria, not universal numerical limits. A business with tight cash may need a smaller commitment even when the base case looks strong.
Set the release conditions
Set the conditions that would change the order, such as a delayed material approval or a sales signal that moves the forecast. Make sure the person with approval authority can act before the useful decision date passes.
Separate a staged release from an informal promise to buy later. Record what the supplier must confirm before each stage moves forward.
Do not approve an order just because the base case looks attractive; the downside must fit the cash the business can carry.
Write down which demand case shaped the decision and who approved the commitment. Record the chosen case, approval owner, and condition that would trigger a change to the commitment.
Conclusion
A safer fashion buy is one whose demand assumptions, delivery window, and financial downside are visible before the commitment. Good inventory management connects variant-level demand with supplier timing, available cash, and a realistic plan for replenishment or leftovers.
Keep the focus on what customers can buy, when the goods can arrive, and how much cash stays at risk. One upcoming style is enough to make the process useful.
Select that style and complete its risk register before issuing the purchase order. For your next order, document the assumptions and approval conditions before the purchase order is released.