

Key Takeaways
- Value Stream Mapping (VSM) is a method for improving processes that shows work, information, and materials from start to finish.
- It helps teams to identify valuable steps and remove waste and delays.
- VSM gives a clear view of the total process to the teams.
- It helps teams to identify waste, delays, and unnecessary steps.
- It separates activities that add customer value and those that do not.
- The seven common wastes are described below.
- The current-state map provides a baseline for improvement.
- It helps businesses map work, find waste, and improve processes.
- VSM also supports Lean, Agile, and DevOps.
Value Stream Mapping (VSM) is a method for improving processes that shows work, information, and materials from start to finish. It helps teams to identify valuable steps and remove waste and delays.
VSM maps the current process and supports a better future process with smoother work and less waste. Companies use VSM in manufacturing, software development, healthcare, services, and other business processes.
Why Is Value Stream Mapping Important?

Value Stream Mapping gives a clear view of the total process to the teams. It connects individual tasks into one complete process. It helps teams to identify waste, delays, and unnecessary steps. Teams can remove these problems and improve customer value.
VSM improves team communication and decision-making. Everyone can use the same process map to understand the workflow. Teams can compare the current state with the future state and create a smoother process.
Benefits of Value Stream Mapping
The benefits of Value Stream Mapping are given below:
Reduces Waste
VSM identifies waiting, unnecessary inventory, movement, defects, production, and processing. Teams remove these activities and improve productivity levels.
Improves Collaboration
A shared value stream map gives the same view of the workflow to the teams. It makes communication and teamwork better in different process stages.
Focuses on Customer Value
VSM separates activities that add customer value and those that do not. Teams can focus on work according to customers’ requirements.
Supports Continuous Improvement
Teams use the current-state map to find problems and the future-state map to plan changes. They can check results and improve the process over time.
The Seven Wastes in Value Stream Mapping
Value Stream Mapping recognizes activities that use time, resources, or effort but don’t add customer value. The seven common wastes are described below.
Overproduction
Overproduction means making more products than required or completing work earlier on time. It makes extra inventory and uses storage space.
Inventory
Inventory waste means keeping more materials, products, or unfinished work than needed. Extra inventory takes up space and increases storage and handling costs.
Motion
Motion waste means unnecessary worker movement. Searching for tools, walking between work areas, and using a poor workplace layout wastes time.
Defects
Defects include errors and problems that require correction or replacement. They waste time and resources and reduce product quality.
Overprocessing
Overprocessing means doing more work than needed. Unnecessary steps, checks, and processing increase completion time.
Waiting
People, materials, information, or work remain idle when the next step is not ready. Waiting increases total process time.
Transportation
Transportation waste means unnecessary movement of materials, products, or information. Extra movement increases time and can cause delays.
Value Stream Mapping Symbols
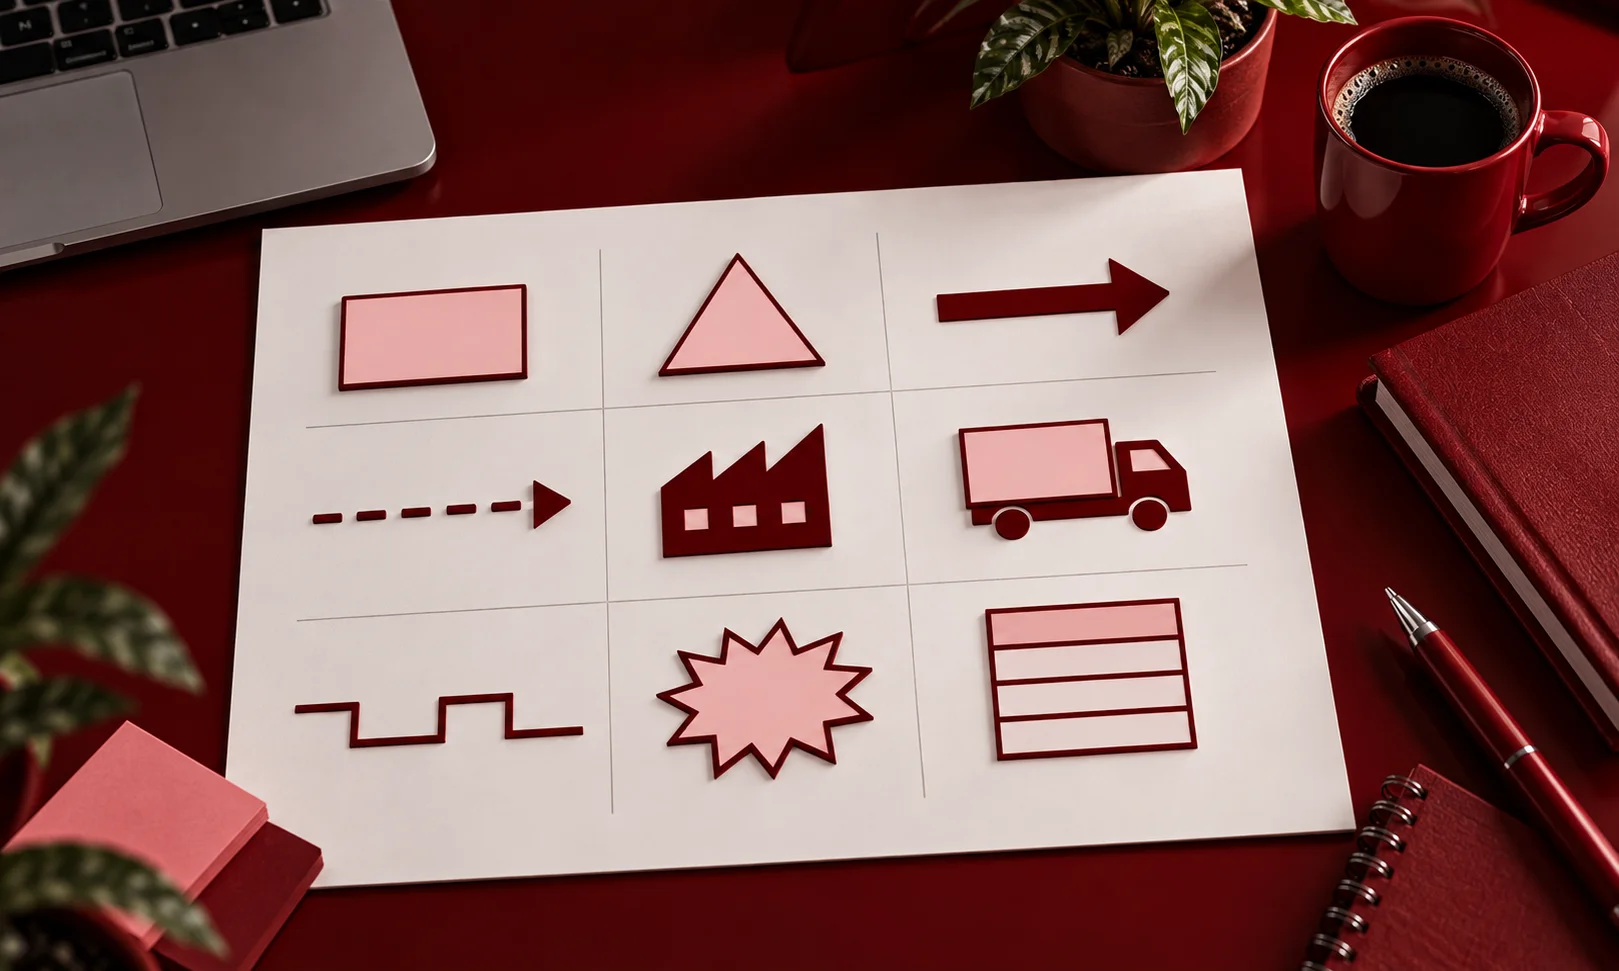
Value Stream Mapping uses symbols to show steps, materials, inventory, customers, suppliers, and waste on a map. These symbols make the process easy and help teams to identify problems.
| Symbol | Represents | Purpose |
| Process Box | Process or activity | Shows the main steps in the workflow |
| Inventory Triangle | Inventory or work in progress | Shows materials or work waiting between steps |
| Arrow | Material flow | Shows the movement of materials or products |
| Information Arrow | Information flow | Shows how information moves through the process |
| Customer/Supplier Icon | Customer or supplier | Shows where the value stream starts or ends |
| Truck | Shipment or transportation | Shows movement of materials between locations |
| Timeline | Lead time and processing time | Shows how much time is spent processing and waiting |
| Kaizen Burst | Improvement opportunity | Highlights an area that needs improvement |
| Data Box | Process data | Records information such as cycle time, uptime, and changeover time |
Using these symbols creates a visual picture of the entire value stream, making waste, delays, and improvement opportunities easier to spot.
Creating a Value Stream Map
A value stream map can be created as follows
1. Define the Problem and Goal
Recognize the main problem and set a clear aim. Clear goal helps to keep the team focused and makes improvement easier to measure.
2. Choose the Product or Service
Choose a specific product, service, or product group. Focus on one process instead of the whole organization.
3. Form the Right Team
Bring people together who understand different parts of the process. Include employees who perform the work and people who can make changes.
4. Set the Scope
Explain the start and end points of the value stream. Clear boundaries help to keep the map focused.
5. Map the Current State
Document how the process works right now. Show the main process steps, inventory, movement, information flow, and other relevant activities. The current-state map provides a baseline for improvement.
6. Map the Information Flow
Show orders, instructions, schedules, and other information flow in the process. Clear information flow helps teams to keep work moving.
7. Collect Process Data
Collect data for each step, including cycle time, processing time, waiting time, and inventory. Use this data to find delays and waste.
8. Create the Timeline
Add processing time and waiting time to the map. This shows the total process time and the time that adds value.
9. Identify Waste and Bottlenecks
Review the map and identify waste, delays, and unnecessary steps. Focus improvement efforts on these areas.
10. Design the Future State
Create a future-state map that shows the improved process. Remove unnecessary steps, reduce delays, and improve workflow.
11. Implement Improvements
Turn the future-state map into an action plan. Assign tasks, make the required changes, and put the plan into practice.
12. Monitor the Results
Measure the process after making changes. Compare the new results with the original results for lead time, waste, and overall performance. Continue improving the process when new problems appear.
Key Value Stream Metrics
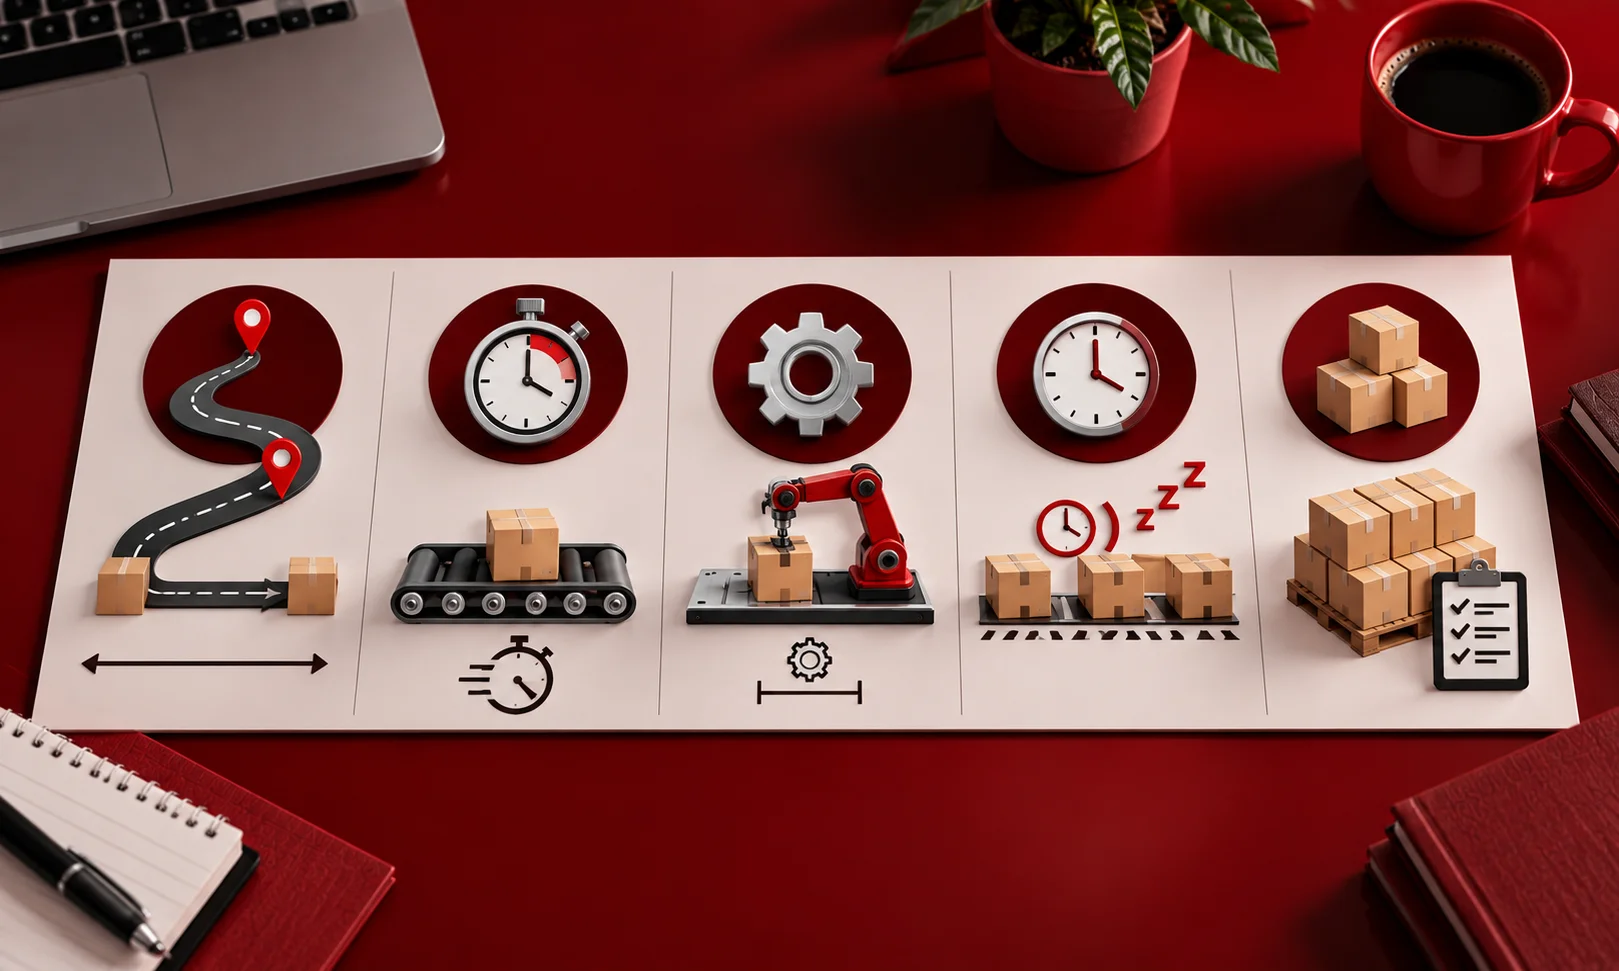
Value Stream Mapping uses metrics to estimate work speed and flow. Teams use these metrics to find delays and identify process improvements.
Lead Time
Lead time measures the total time from start to finish. It includes working time and waiting time. Teams can reduce unnecessary lead time to deliver products and services faster.
Cycle Time
Cycle time measures the time required to complete one process step. Teams compare cycle times to find slow steps.
Processing Time
Processing time measures the time spent when doing the actual work. It does not include waiting between steps.
Waiting Time
Waiting time measures the time work remains idle. Long waiting times increase lead time without adding customer value.
Work in Progress
Work in progress (WIP) includes unfinished items in a process. High WIP can create congestion, increase waiting, and hide problems.
Value Stream Mapping Use Cases
VSM helps businesses map work, find waste, and improve processes.
Manufacturing
Manufacturing teams use VSM to track materials, production, inventory, and finished products.
Software Development
Software teams use VSM to check work from planning to delivery.
Healthcare
Healthcare teams use VSM to check patient movement, information, and services.
Service Operations
Service teams use VSM to check customer requests, information, decisions, and service delivery.
Value Stream Mapping in Lean, Agile, and DevOps
Value Stream Mapping supports Lean, Agile, and DevOps.
- In Lean, teams use VSM to reduce waste and improve the flow of materials and work. They compare the current process with the future process and focus on customer value.
- In Agile, teams use VSM to check work from requests to development. They can find bottlenecks and waiting times.
- In DevOps, teams use VSM to check software from development through testing, deployment, and delivery. They can find slow steps and improve software delivery.
Common Challenges and Best Practices
Teams can face problems when they use the wrong data, set unclear process boundaries, or focus on individual tasks instead of the full process. Resistance to change and limited team input can also slow improvement.
Best Practices
- Set a clear goal before creating the map.
- Include people from different process stages.
- Map the actual process, not the planned process.
- Use real data to find delays and waste.
- Keep the scope small and focus on one value stream.
- Find waste and bottlenecks before making changes.
- Create a practical future-state map with clear actions.
- Measure results after making changes.
- Keep improving the process as new problems appear.
Value Stream Mapping vs. Value Stream Management
| Point | Value Stream Mapping | Value Stream Management |
| Main Focus | Visualizing and analyzing a value stream | Managing and improving value streams continuously |
| Purpose | Finding waste, delays, and improvement opportunities | Improving value delivery and overall performance |
| Method | Uses visual maps of the process | Uses data, monitoring, and ongoing analysis |
| Time Frame | Often focuses on the current and future state | Focuses on continuous improvement |
| Scope | Usually examines a specific process or value stream | Can manage value streams across an organization |
| Key Activities | Mapping processes, identifying waste, and designing improvements | Measuring performance, tracking value, and prioritizing improvements |
Conclusion
Value Stream Mapping (VSM) helps teams see the complete process from start to finish and identify waste, delays, and unnecessary steps. By mapping the current state and designing a future state, teams can create a smoother workflow with less waste. VSM can be used in manufacturing, software development, healthcare, and service operations, and it supports Lean, Agile, and DevOps. Using process data and monitoring results helps teams to measure improvements and continue improving the process over time.
Frequently Asked Questions
What Are the Seven Wastes in Value Stream Mapping?
The seven wastes in value stream mapping are overproduction, inventory, motion, defects, overprocessing, waiting and transportation.
Is Value Stream Mapping Lean or Six Sigma?
VSM is mainly a Lean tool that is used to identify waste and improve workflow. It can also support Six Sigma process improvement.
What Is the Difference Between Value Stream Mapping and Value Stream Management?
Value Stream Mapping visually maps a process to identify waste, delays, and bottlenecks, while Value Stream Management continuously monitors and manages value streams to improve performance, delivery, and customer value.
What Is a Current-State Map?
A current-state map shows working of processworks right now. It records the process steps, information flow, inventory, processing time, waiting time, and other relevant data to help identify waste and delays.
What Is a Future-State Map?
A future-state map shows how a process should work after improvements. It also helps teams to reduce waste, delays, and bottlenecks and create a smooth flow of work.